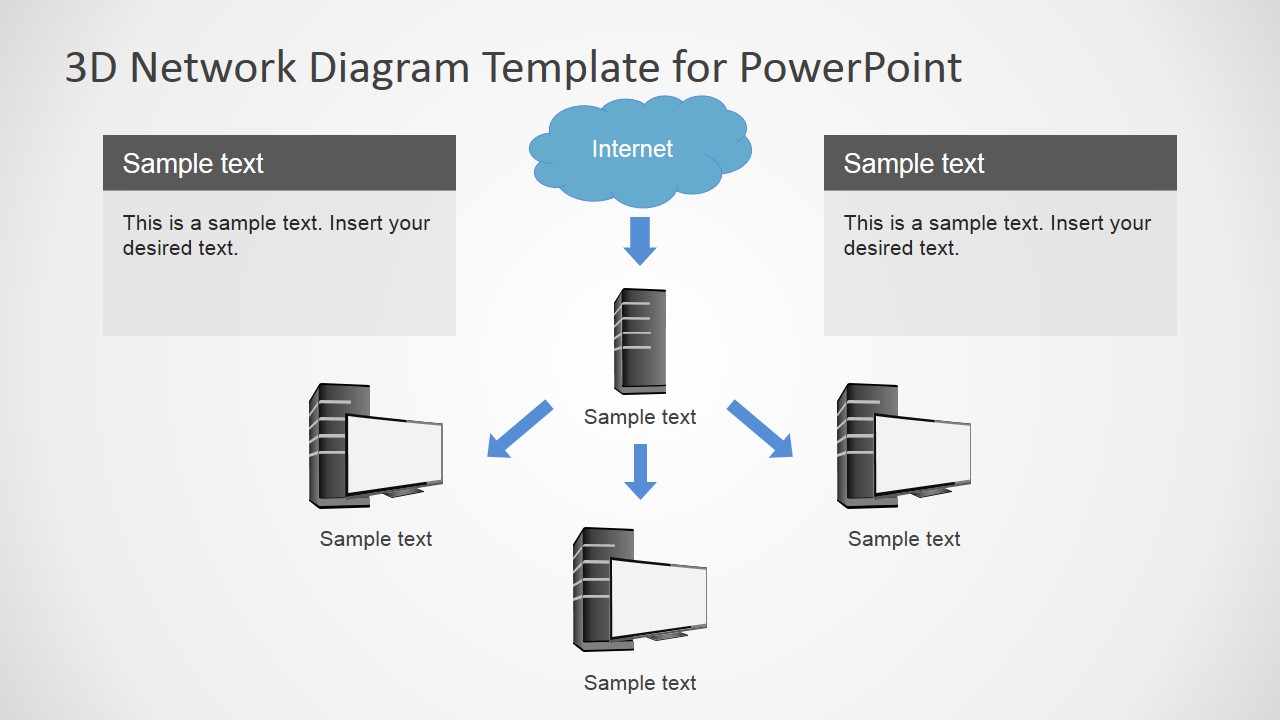
3D Computers Network Diagram for PowerPoint is a professional PowerPoint presentation featuring hardware devices used in computer networks. The computer network diagrams are an everyday tool in the IT industry. Engineers can map applications through the hardware devices that execute them and how they communicate with other devices. It also describes which kind of hardware is required and how it is deployed in a computer network.
A computer network diagram is a schematic describing the nodes and connections between them, in a computer network or data communication network.
In order to identify common network appliances, readily identifiable icons are generally used. The styles of the lines between nodes indicate the type of connection. Clouds are used to represent networks outside the current networks boundaries.
The topology of the network (physical network) can be mapped directly in a network diagram as the graph represented by the diagram nodes and connections. The Topology of the logical network , can be inferred from the network diagram and the information of the network protocols used for the communication.
The most common topologies that can be described with a Computers Network Diagram are:
- Point to Point (P-to-P) represented as a direct connection between two devices.
- Bus: In a Local area Network, devices are all connected to the same communication channel. All communications are broadcasted.
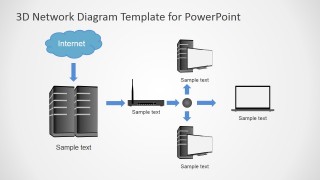
- Star: All devices are connected to a central device in charge of distributing communications.
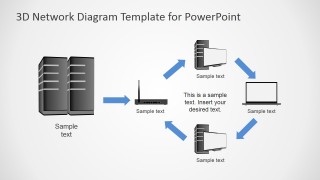
- Ring: Devices are connected to two more devices. The connection of all devices end up being a circuit (circular)
- Tree: Tree Nodes structure.
- Hybrid: Combination of the previous topologies.
Create professional network diagram with SlideModel’s 3D Computers Network Diagram for PowerPoint.
What’s inside this template
Example presentation scenarios
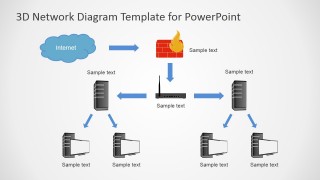
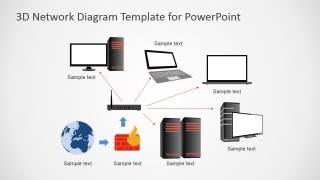
- A network engineer can use the firewall gateway slide to explain how internet traffic passes through a security device before reaching internal servers and client machines.
- An IT manager can use the star topology slide to brief stakeholders on how desktops, laptops, and server groups connect through a central router.
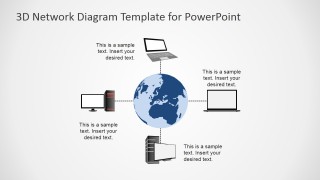
- A systems architect can use the globe-centered WAN slide to show remote device connectivity across an external network during an infrastructure planning meeting.
- A technical trainer can use the server-to-router circular flow diagram to teach how endpoints communicate through network hardware and directional traffic paths.
Features
- 100% editable presentation template
- Compatible with Microsoft PowerPoint and Google Slides
- 16:9 aspect ratio slides
- Scalable vector shapes, icons and illustrations
- AI-Ready for Microsoft Copilot and Claude
- Instant access and download
Frequently asked questions
Q: How should a presenter explain a network design clearly with this template?
A: Start with the slide that matches the audience's mental model: a star topology for business stakeholders, a firewall gateway for security review, or a globe-centered WAN view for remote connectivity. Replace generic labels with actual device roles, keep each arrow tied to one traffic idea, and avoid loading every diagram with all technical details.
Q: Who is this network diagram template best suited for?
A: It works best for IT managers, network engineers, systems administrators, and solution architects who need to explain hardware relationships without showing a dense technical blueprint. The 3D servers, routers, laptops, desktops, internet clouds, and firewall symbols make it useful for project briefings, topology reviews, training sessions, and infrastructure proposals.
Q: Why do the 3D device icons and topology metaphors help communication?
A: The device icons reduce interpretation time because viewers can quickly distinguish servers, endpoints, routers, internet access, and firewall boundaries. The visible metaphors, such as the cloud for external networks and the brick wall for security filtering, let the presenter explain abstract traffic flow using familiar visual anchors.



3D Computers Network Diagram for PowerPoint
7-slide presentation template for 3D network topology, LAN diagrams, servers, routers, and firewall flows
3D Computers Network Diagram for PowerPoint is a 7-slide diagram template for mapping computer networks. It includes server-to-device connections, internet cloud paths, firewall gateway diagrams, star topology layouts, and router-centered LAN views. It is intended for IT, networking, and infrastructure presentations in Microsoft PowerPoint and Google Slides.
- Category
- Diagrams
- Rating


 Loading...
- Aspect ratio
- 16:9, 4:3
- Item ID
- 6180-01
- Colors
 Microsoft PowerPoint
  Microsoft Copilot
  Claude for PowerPoint
 Other formats supported
Subscribe today and get immediate
access to download our PowerPoint templates.