Slide 5 of 5 from 3D Area Chart for PowerPoint
6054-01-3d-area-chart-5
3D Area Chart with Editable Text Areas
- Chart
- Other
- Evaluation Slide
- 16:9
- 100% Editable
What’s on This Slide
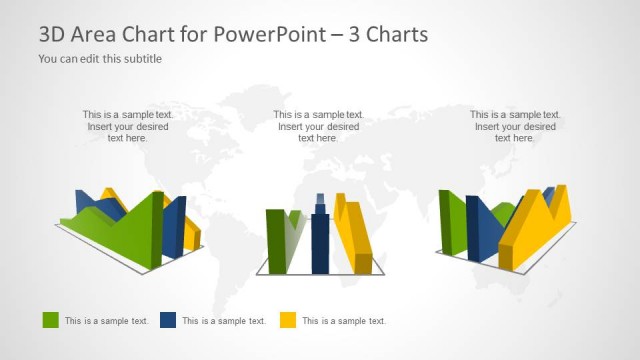
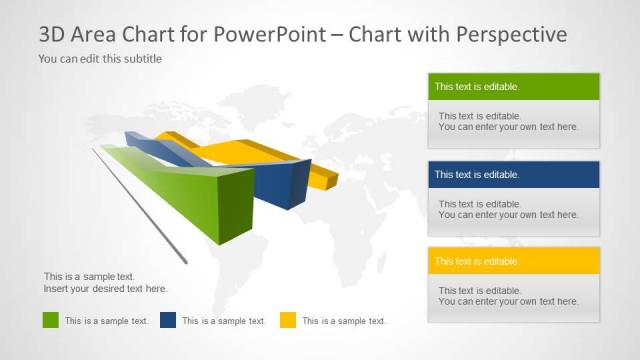
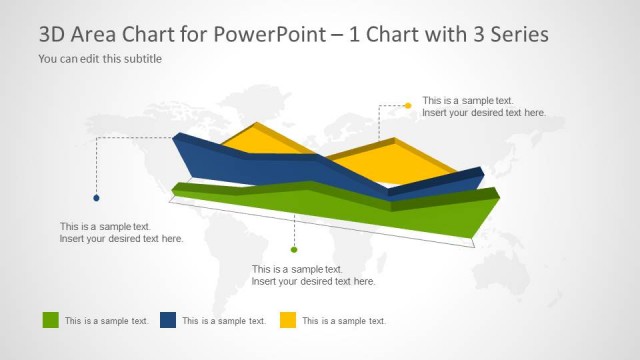
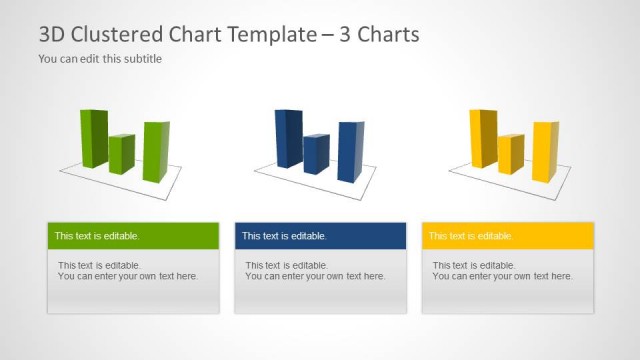
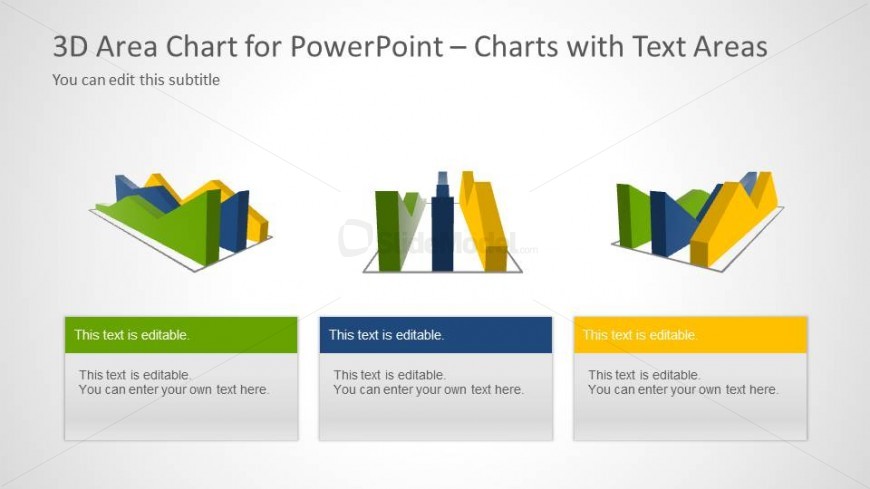
The layout features three distinct 3D area charts arranged horizontally across the slide. Each chart has a unique color scheme, with green, blue, yellow, and orange shapes representing data series. Below each chart, there are editable text placeholders aligned centrally, allowing for descriptions or data points. The top of the slide includes a title and subtitle, both left-aligned. The background is light gray, providing contrast to the colorful charts. The overall composition is balanced, with clear visual separation between the charts and text areas.
How to Use It
This layout serves as a comparative analysis tool, ideal for showcasing multiple data series in a 3D format. It fits well in a presentation sequence after introducing data trends or insights. Suitable for business contexts like sales performance reviews, market analysis, or project updates, it allows for clear communication of complex data. The editable text areas enable customization for specific audience needs, enhancing engagement and understanding of the presented information.
Text Placeholders & Capacity
Keep your copy within these limits so it fits without resizing. Node body slots can hold about 10 words each.
| Placeholder | Count | Max characters (approx.) |
|---|---|---|
| Slide title | 1 | 30 |
| Subtitle | 1 | 30 |
| Item body | 3 | 50 |
Slide Keywords
Download unlimited PowerPoint templates, charts and graphics for your presentations with our annual plan.
DOWNLOADReturn to 3D Area Chart for PowerPoint.