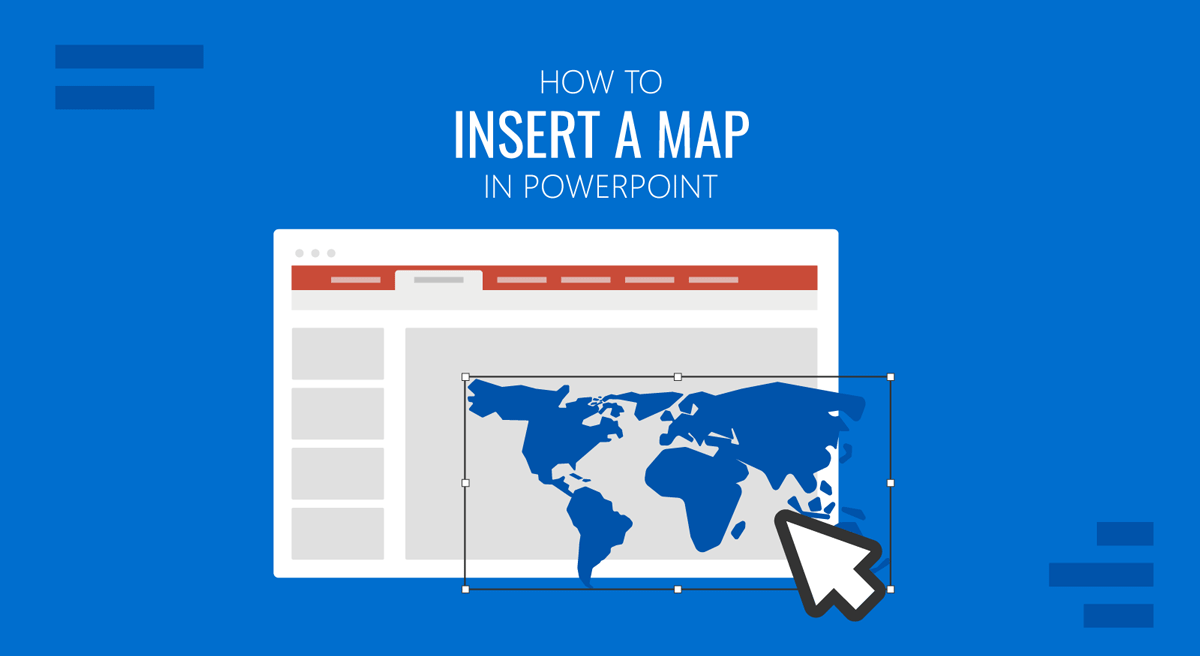
Maps can visualize geographic data, illustrate global operations, and help contextualize information in a presentation. Be it regional sales data, travel routes, global data, market share, or other geographical information, inserting a map in PowerPoint can add geographic context. This tutorial breaks down three different methods for inserting a map in PowerPoint. This includes Microsoft’s built-in chart features, Google Maps screenshots, and editable PowerPoint map templates that can give you enhanced customization and control for your map slides.
Why Use a Map in PowerPoint?
Maps are among the intuitive and impactful visual tools for presenting geographic or location-based information. There are various benefits of using them in PowerPoint presentations. They not only enhance visual appeal but also improve audience retention and impact, making your message more accessible and compelling for any audience.
1. Simplify Complex Regional or Global Narratives: When text and numbers overwhelm, maps deliver visual simplicity that enhances understanding, which is ideal for investor briefings, stakeholder updates, or executive summaries. By placing information in a geographic frame, maps bring clarity to presentations. Adding a map allows your audience to easily understand location-based data at a glance, especially when paired with charts, icons, or text labels.
2. Showcase Geographical Market Data: Maps can show market penetration by region. You can visualize sales, customer demographics, or market share by country, region, or city. This is especially helpful for comparing regional performance or justifying expansion strategies.
3. Illustrate Locations or Supply Chains: A map with labeled touchpoints gives a clear picture of logistics, hubs, and operational reach across the globe.
4. Support Data Storytelling with a Geographic Focus: Maps help present statistics with spatial relevance, whether it’s tracking disease outbreaks, election results, or resource allocations.
5. Provide Educational Context: From history and geography to environmental studies, maps help students make connections between abstract concepts and real-world locations.
Method 1: Insert a Map in PowerPoint Using the Built-in Chart Feature (PowerPoint 2019 & Later Editions)
PowerPoint includes a basic map feature for plotting geographic data. This feature works with PowerPoint 2019 and later editions. This method is most effective when you have data available for each country, state, or region. It helps show values across countries (e.g., sales, population, regional KPIs, etc).
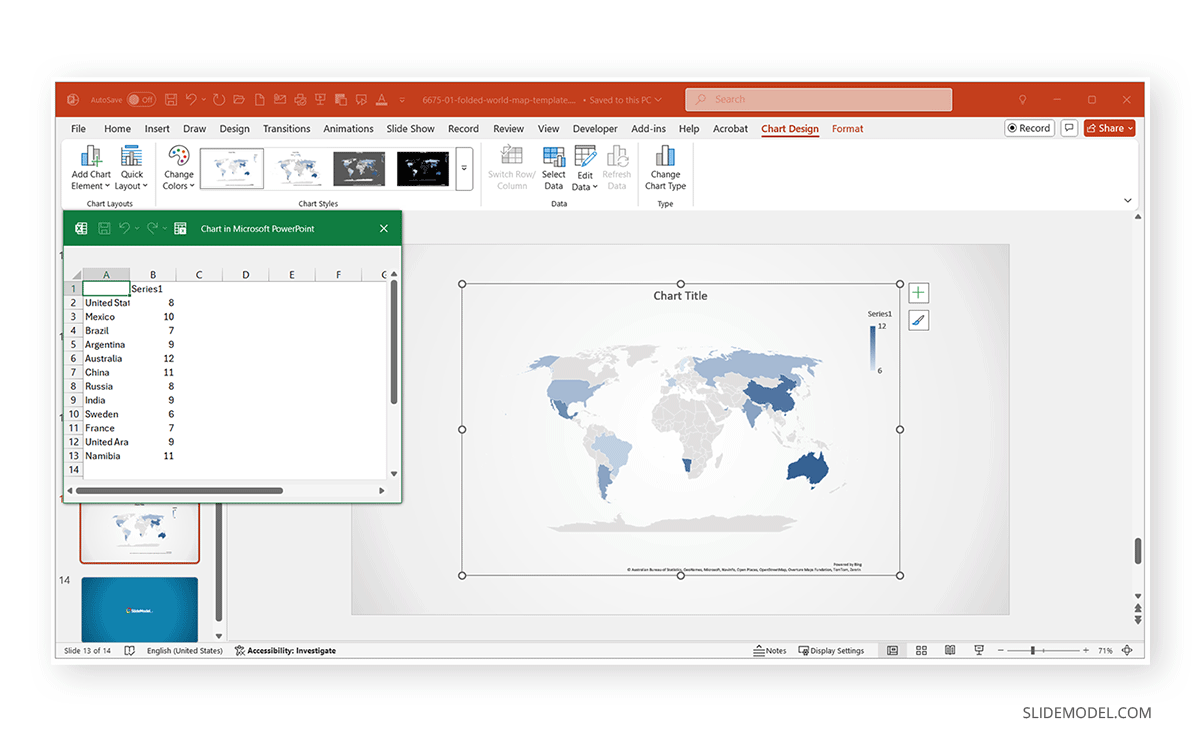
Step 1: To insert a map in a PowerPoint slide, go to Insert -> Chart -> Map.
Step 2: A world map chart will appear along with an Excel table. Input your region or country names and corresponding values.
Step 3: Close the Excel window to update the map in PowerPoint.
You can adjust map styles (shades and color gradients), legends, labels, and font and fill colors to customize the map. However, this tool is limited to basic country or region plotting and lacks flexibility in customization. This is also an easy method to insert a world map for PowerPoint presentation slides.
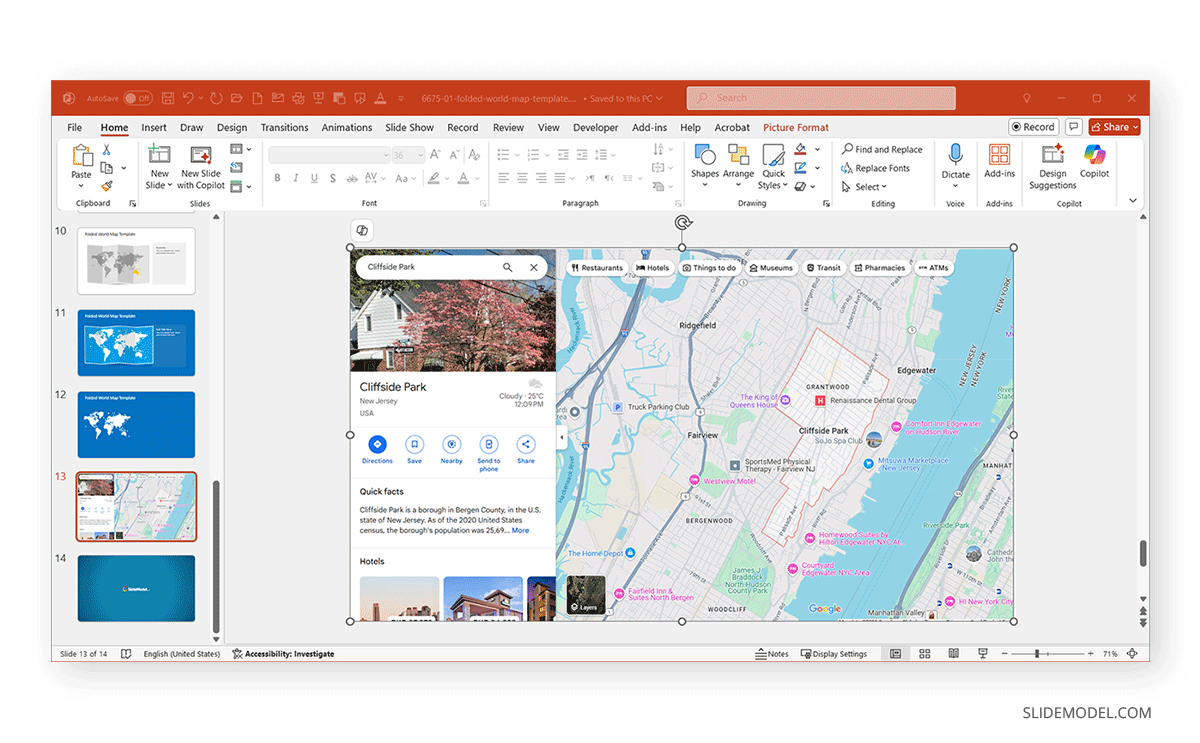
Method 2: Inserting Maps Using Google Maps Screenshots
For more specific location visuals, such as a pin on a city or custom zoom level, you can use a Google Maps screenshot:
Step 1: Go to Google Maps, search, and zoom into your desired area.
Step 2: Use the following methods for different devices to capture a screenshot from Google Maps:
- Windows: Use your Print Screen key or Snipping Tool.
- Mac: Use Screenshot to capture the map or use Shift+Command+4.
- Android: Simultaneously Press the Volume Up+Power buttons.
- iOS: Press the Side+Volume Up (or Home) buttons simultaneously.
Step 3: Open your PowerPoint slide and select Insert -> Pictures -> This Device and upload the screenshot.
Step 4 (Optional): To clean up the screenshot, crop the map to remove browser interface elements, add shapes or icons to mark locations or routes, and add overlay text boxes to add labels.
Pro Tip: To maintain visual clarity, avoid overstretching screenshots and keep the resolution high. You can also resize an image proportionally on a desktop computer by selecting it and using the handles to stretch it while holding the Shift key.
Method 3: Insert a World Map Using SlideModel’s Fully Editable PowerPoint Map Templates
While PowerPoint’s native tools and screenshots can be helpful in simple cases, editable map templates provide a far more flexible and professional solution. SlideModel offers a large collection of PowerPoint map PPT templates. These PowerPoint Map Templates include fully editable slide decks. As SlideModel’s maps are fully editable, you can highlight regions with color coding, isolate areas by deleting or fading others, and combine multiple maps in a single presentation.
SlideModel’s PowerPoint Map Templates
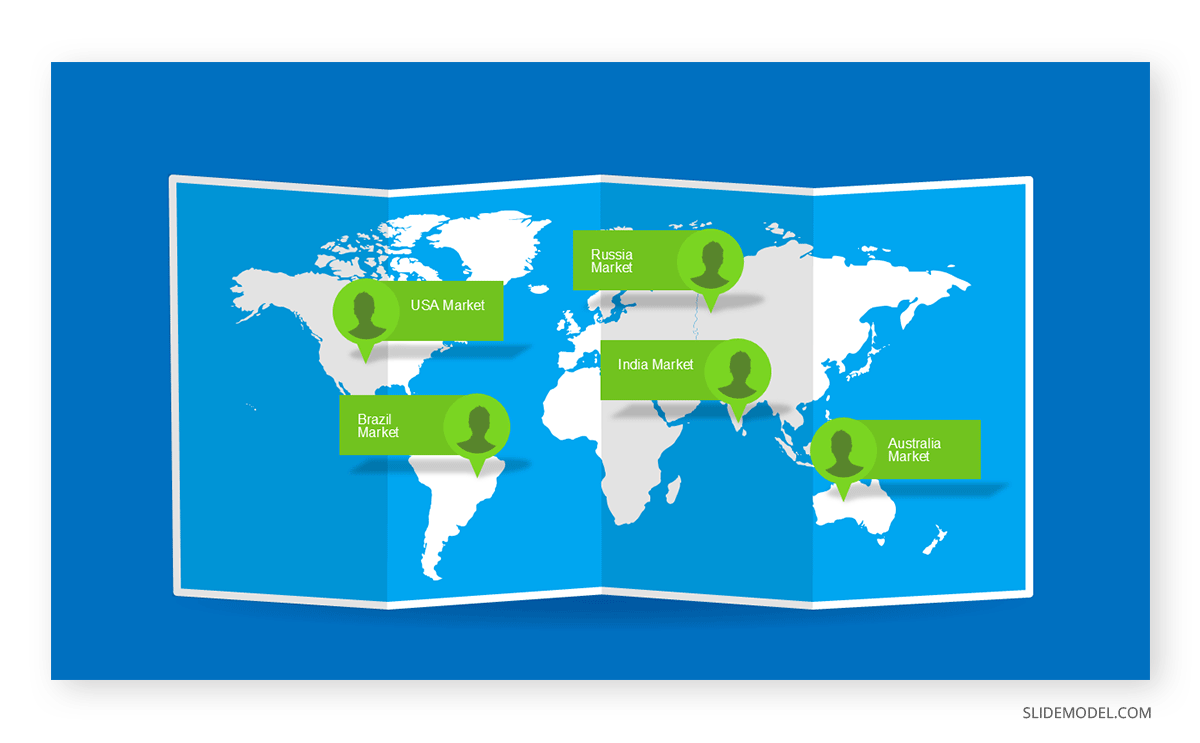
Using editable templates, especially from a resource like SlideModel, means you’re not just inserting a map, you’re building a visually coherent, audience-ready tool to enhance your storytelling. For example, a global operations slide might use a world map to show office locations with labeled markers. At the same time, a regional sales dashboard can leverage a US map PowerPoint slide with color-coded states.
World Map
Various global map PowerPoint template designs show the complete map of the world. These diverse styles of comprehensive global maps have been designed to enhance international presentations and strategic discussions with fully editable slides. You can also choose to download animated map templates to suit your needs.
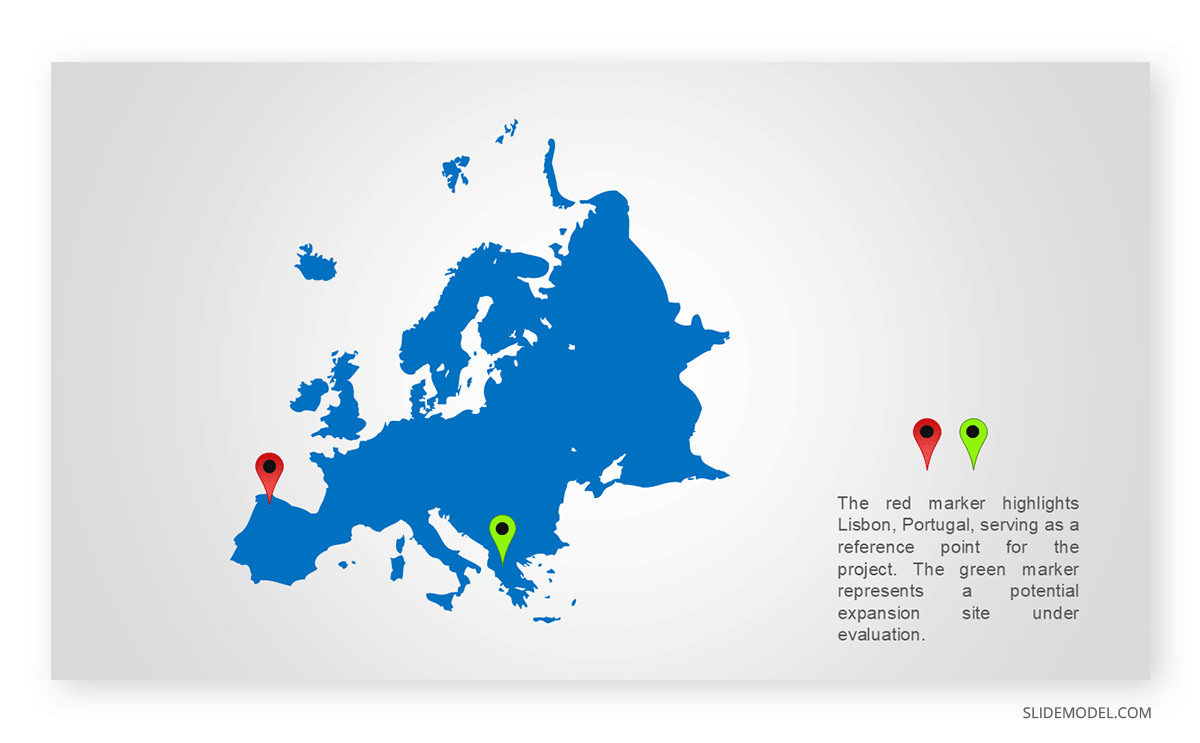
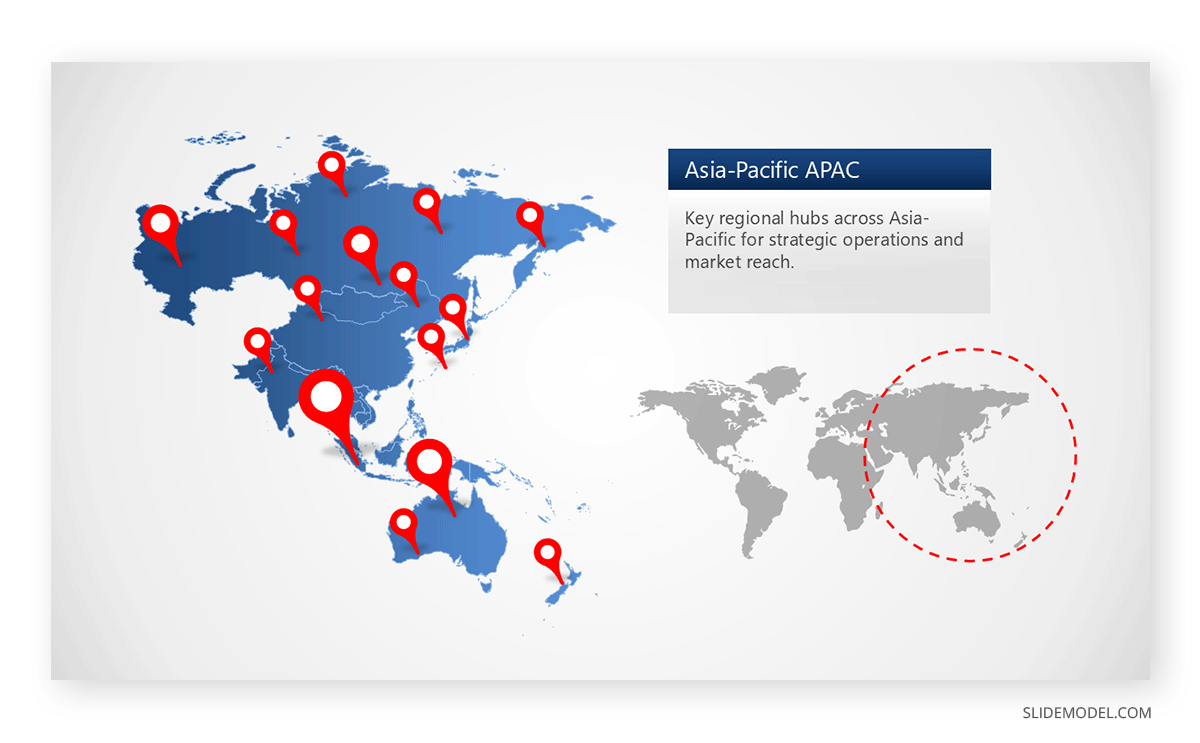
Continental Maps
Maps include all continents, including Europe, Asia, Africa, South America, North America, Australia, and Antarctica.
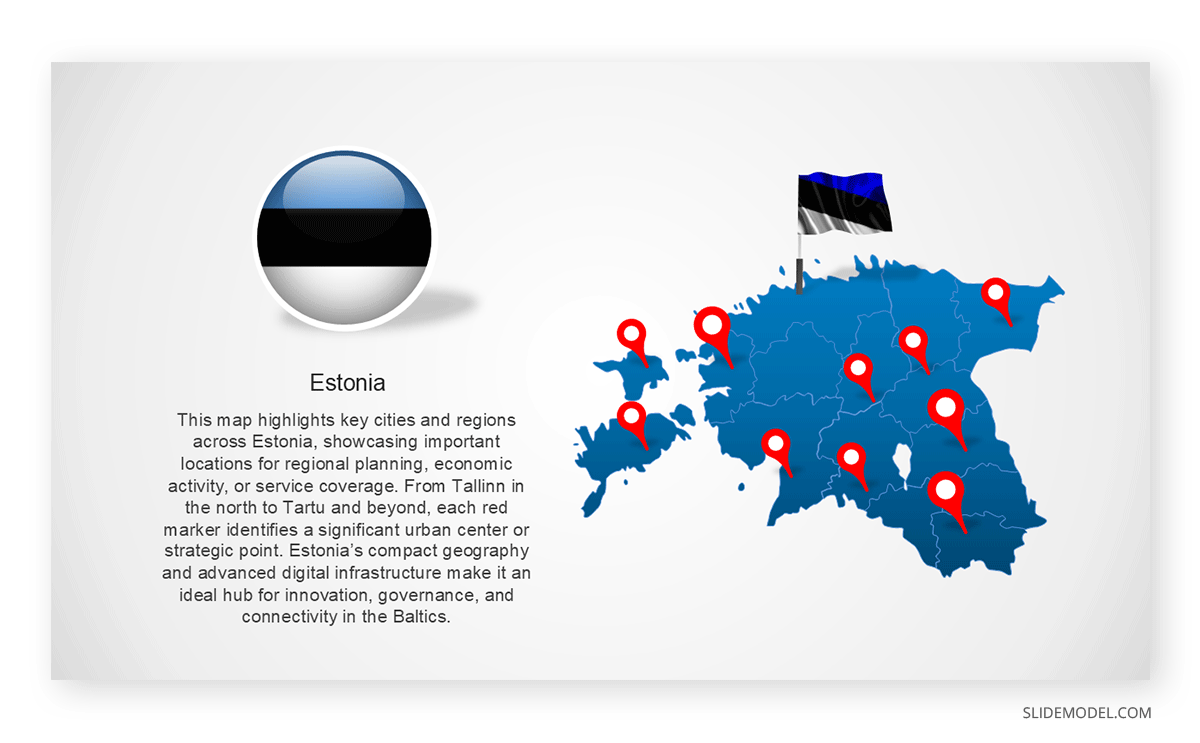
Country Maps
This range includes dozens of countries from around the world such as detailed US map PowerPoint template designs, as well as PowerPoint map templates for Canada, UK, Russia, France, Germany, Spain, Poland, Ukraine, Portugal, Brazil, Argentina, Uruguay, India, Sri Lanka, China, Pakistan, and various middle eastern countries such as Iraq, UAE, Kuwait, Qatar, etc.
Region-specific or State-level Maps
These PowerPoint map templates by SlideModel cater to more focused geographical presentations, such as maps for the European Union, the DACH region (Germany, Austria, and Switzerland), East Africa, the Middle East, and individual U.S. states, providing clarity and detail for targeted regional analyses.
Advantages of Using Editable Map Templates
Editable map PowerPoint templates offer several distinct benefits that go beyond aesthetic appeal—they provide structure, adaptability, and a more streamlined workflow for professionals across industries.
Design consistency: Professionally designed templates ensure that your map visuals align with the overall tone and layout of your presentation, providing a cohesive and professional appearance. Each region, label, and icon is carefully proportioned and harmonized, eliminating the visual inconsistencies that often arise with manual formatting.
Customizability: Whether you’re highlighting specific sales territories, planning regional rollouts, or showcasing survey results, editable templates let you tweak individual regions, colors, and borders. You can isolate countries or states, recolor specific zones, and layer elements with icons or text—perfect for tailored messaging.
Scalability: Since these maps are vector-based, you can enlarge or reduce them without losing image quality. This makes it easy to adapt the same map for title slides, dashboards, infographics, or printable handouts.
Efficiency: Editable templates save hours of work. Instead of trying to draw borders or import clunky images, you start with a layout that’s presentation-ready. Simply plug in your data, customize a few labels, and that’s it.
Professional Impact: A polished map slide immediately signals attention to detail. Whether in a pitch deck, quarterly review, or academic lecture, clean, editable maps show that you’ve invested in clear communication.
Reusability: These templates can be repurposed for different projects, departments, or teams. By duplicating and tweaking slides, you can maintain a consistent look across all your geographic reporting without starting from scratch.
Enhancing Maps with PowerPoint Tools
Once your map is inserted (regardless of method), you can enhance its communication power using PowerPoint’s built-in tools and features. These small touches not only make your map more visually engaging but also reinforce the clarity of your message.
Add Icons: Use PowerPoint’s icon library (Insert -> Icons) to place universally recognizable symbols such as location pins, factories, or airplanes. This can help audiences quickly interpret functions or destinations on the map without additional explanation.
Draw Routes: Use the Curve or Scribble tools under Insert -> Shapes to illustrate supply chains, flight paths, delivery routes, or migration flows. Combining these lines with animated motion paths can further simulate movement and interaction.
Apply Animations: Use animations like Fade, Appear, or Zoom to introduce map elements gradually. This is especially useful in live presentations where you want to control the viewer’s focus and avoid overwhelming them with all the information at once.
Use Text Boxes: Add clean, concise labels to your map using text boxes. Make sure they don’t clutter the layout. Use formatting, such as bold or colored text, to differentiate between categories (e.g., capital cities, branches, regions).
Group Elements: Once you’ve added customizations like icons and text, group these elements with the map itself. This lets you move and scale everything as a single unit, saving time and preserving alignment.
Apply Color Coding: If presenting comparisons (e.g., high vs. low performance regions), use a consistent color scheme across the map and legend. This makes your visual message more intuitive and immediately understandable.
The enhancements mentioned above not only add visual appeal but also support more straightforward storytelling and more meaningful data presentation.
FAQs
Can I insert a map directly from Bing Maps or Google Maps into PowerPoint?
PowerPoint doesn’t support live Bing or Google Maps integration. However, you can take a screenshot from Google Maps or Bing Maps and insert it as an image using Insert > Pictures > This Device.
Can I add a map using PowerPoint’s built-in tools?
Yes. In newer versions of PowerPoint (Office 365 and 2021), you can use Insert > Icons or Insert > 3D Models to add visual map elements.
How can I highlight specific countries or regions on a map?
Insert a vector-based map (SVG or EMF). Ungroup the map objects (Right-click > Group > Ungroup twice), then format individual countries or regions using Shape Fill or Shape Outline.
Can I animate parts of a map in PowerPoint?
Yes. After ungrouping the map, apply animations like Fade, Zoom, or Appear to individual regions using Animations > Add Animation.
Where can I find free map templates for PowerPoint?
You can find free maps on SlideModel free PowerPoint templates section. Microsoft Office also offers limited templates via File > New > Search for “Map”.
How can I customize a map’s colors in PowerPoint?
If the map is a vector or grouped shape, you can change colors using Format > Shape Fill or use the Format Painter for uniform styling.
Can I insert an interactive map in PowerPoint?
Interactivity in native PowerPoint is limited. However, you can create a pseudo-interactive experience using Action Buttons, Hyperlinks, and Triggers tied to map areas.
How do I label specific cities or points on a map?
Insert Text Boxes over the map to label cities or landmarks. Use Insert > Shapes > Line/Arrow for pointers, and group them with the text to move them together.
Final Words
Knowing how to insert a map in PowerPoint gives you the ability to add meaningful context, especially when communicating spatial information. From native charts to real-world screenshots and editable templates, each method serves a different purpose.
While built-in features and Google Maps can handle basic needs, SlideModel’s PowerPoint map templates deliver both flexibility and visual excellence. Whether you’re preparing a global sales overview or detailing a local project, inserting the right map brings focus and professionalism to your message. You can explore SlideModel’s collection to find a world map for PowerPoint presentations, US map PowerPoint slides, as well as continent, country, or other regional templates, and tailor them for your audience.