Data Dashboard Chart Slide for PowerPoint
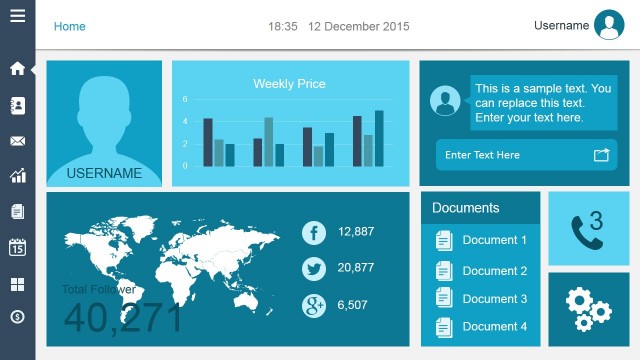
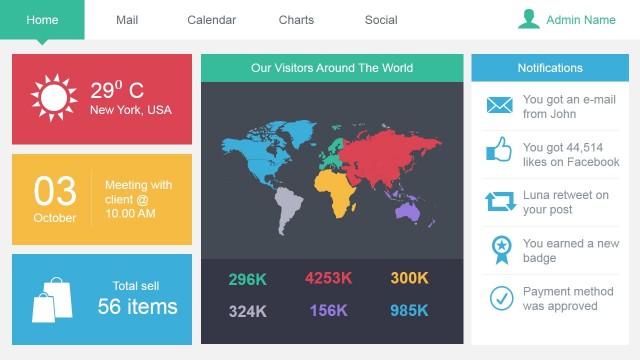
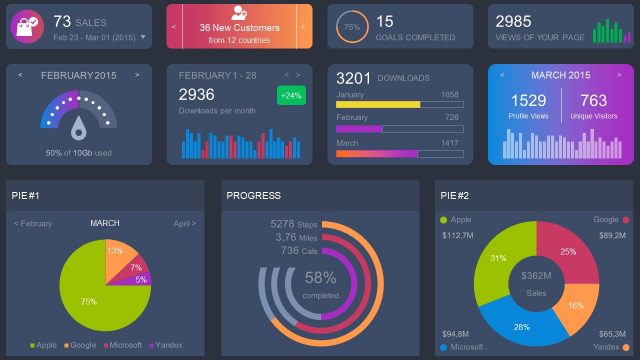
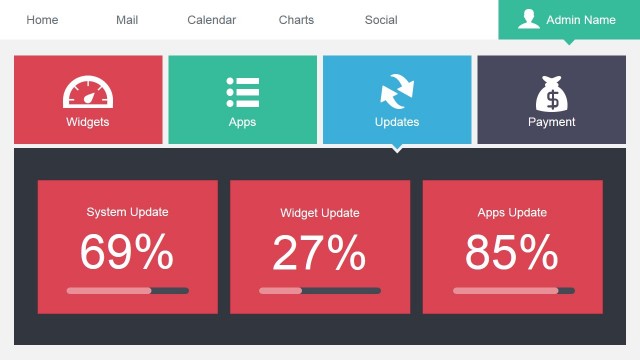
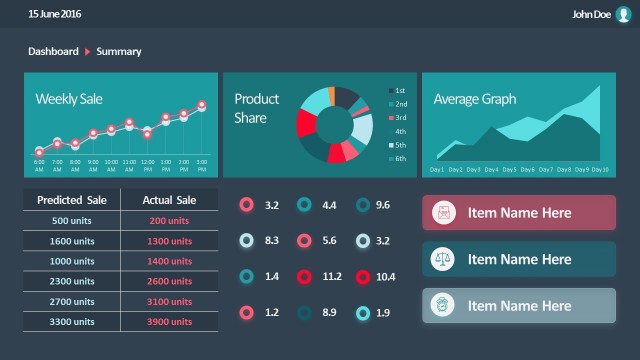
The Data Dashboard Chart Slide for PowerPoint located in this slide design may be used to simultaneously present multiple types of data, such as customer volume, market sales, and other financial statistics.
The PowerPoint slide features a collage of different charts, such as a line chart for tracking sales projections, a vertical bar graph for showing different materials consumption for production, a doughnut diagram to demonstrate the buyer and product demographic which contribute to sales, and an area chart for financial statistics. The PowerPoint objects are 100% editable to suit the presenter’s needs and preferences.
Return to Admin Dashboard PowerPoint Template.