Slide 11 of 38 from Free Timeline Infographics
Six Phase 3D Bars Infographics Timeline
Timeline Infographics for Presentations
- Diagram
- Timeline Horizontal
- Timeline Slide
- 16:9
- 100% Editable
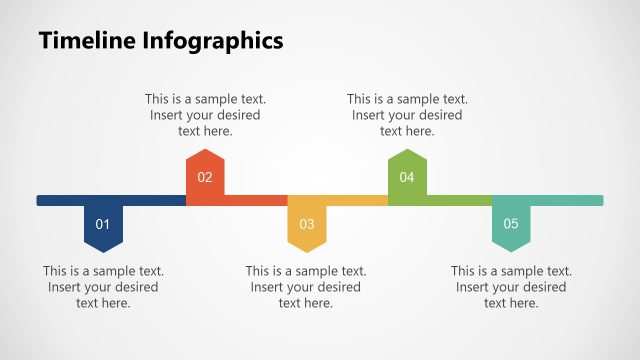
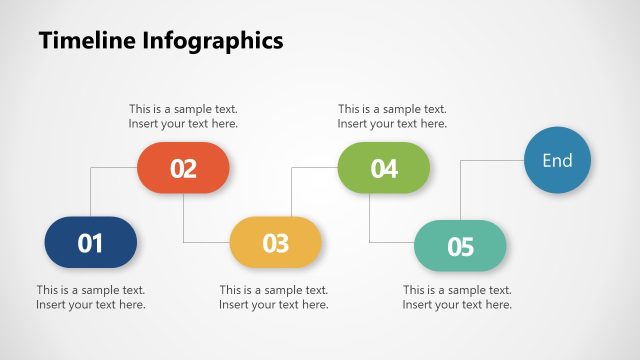
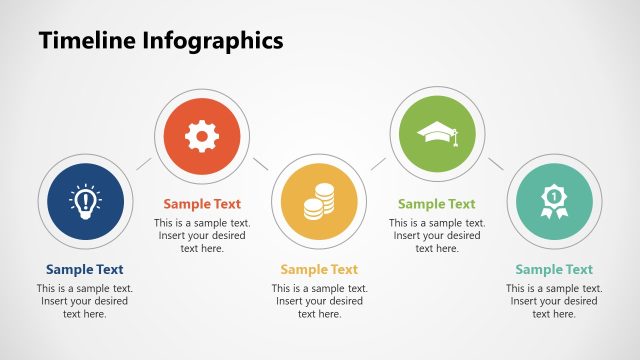
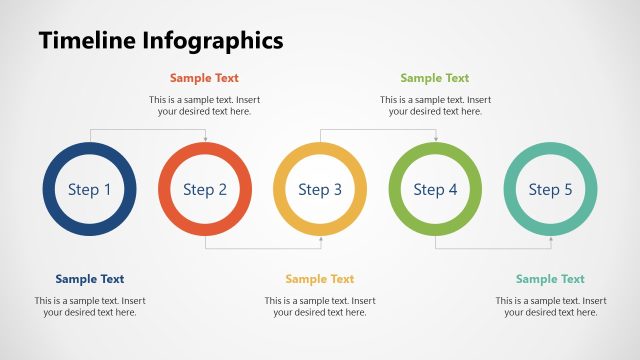
The Timeline Infographics slide from the Free Timeline Infographics template offers a visually engaging way to present chronological events. With its horizontal layout featuring six distinct colored segments, this slide is perfect for showcasing project timelines, historical overviews, or product development stages. The clear visual progression aids in communicating milestones effectively, making it an essential addition to any business presentation or pitch deck template.
What’s on This Slide
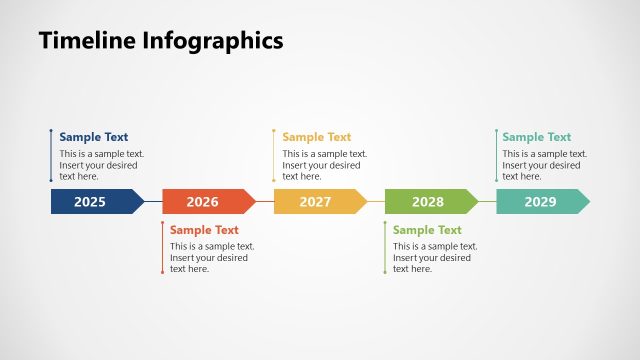
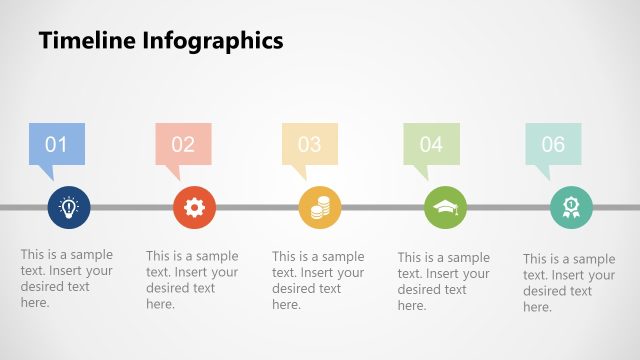
The slide features a horizontal timeline layout with six curved segments. Each segment is colored differently, with the first segment in blue, the second in red, the third in orange, the fourth in yellow, the fifth in green, and the sixth in gray. Numbered labels are positioned above each segment, while sample text placeholders are aligned below each segment. The segments flow from left to right, creating a visual progression. The background is light gray, enhancing the visibility of the colored segments and text placeholders.
How to Use It
This layout serves as a timeline infographic, ideal for illustrating chronological events or processes. It fits well in presentations that require a clear visual representation of sequential information. Common scenarios include project timelines, historical overviews, or product development stages. This slide can be used to communicate milestones or key phases in a business context, making it suitable for project management or strategic planning discussions.
Text Placeholders & Capacity
Keep your copy within these limits so it fits without resizing. Node body slots can hold about 10-12 words each.
| Placeholder | Count | Max characters (approx.) |
|---|---|---|
| Item heading | 6 | 20 |
| Item body | 6 | 50 |
Slide Keywords
Download unlimited PowerPoint templates, charts and graphics for your presentations with our annual plan.
DOWNLOADReturn to Free Timeline Infographics.