Slide 10 of 26 from Free SWOT Infographics
Square Shape with Circular Internal Design PPT Slide
SWOT Analysis Infographics for Presentations
- Diagram
- Matrix Quadrant
- Strategic Analysis Slide
- 16:9
- 100% Editable
What’s on This Slide
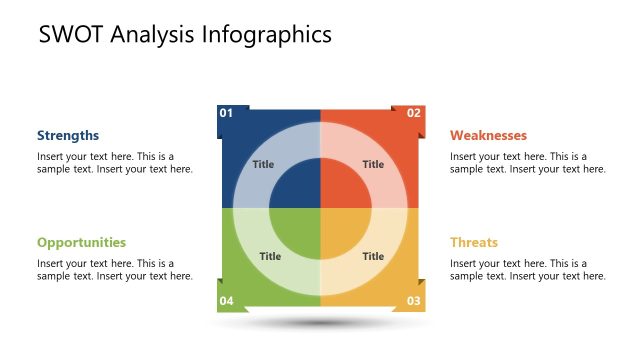
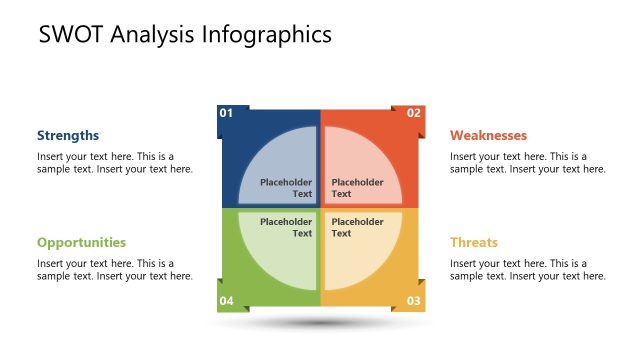
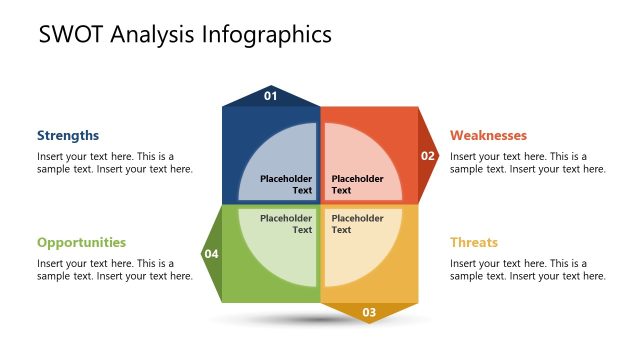
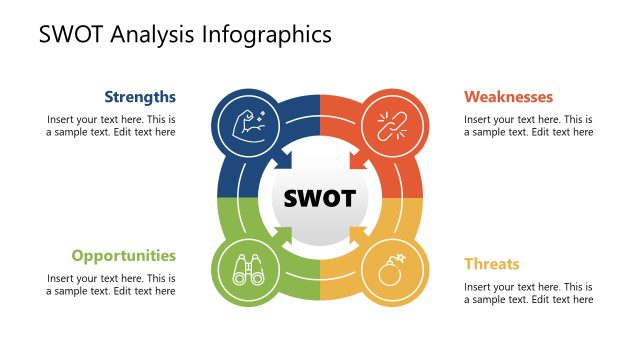
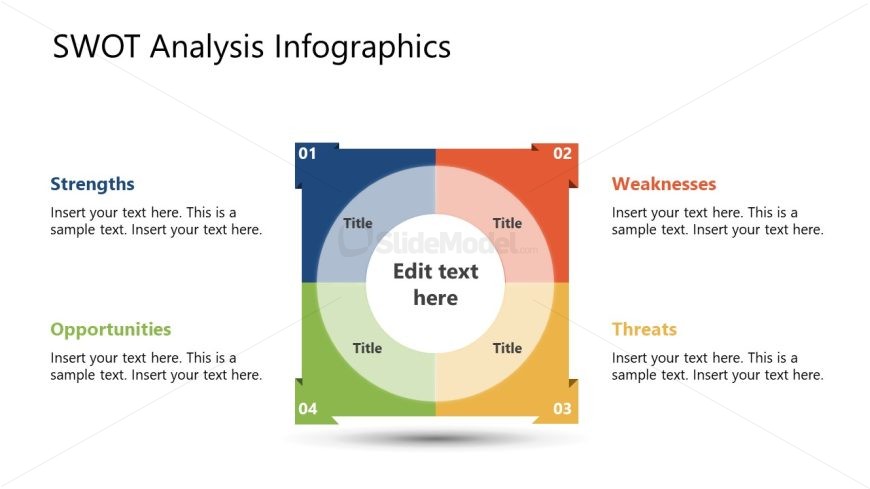
The layout features a central circular area surrounded by four quadrants, each representing a component of SWOT analysis: Strengths, Weaknesses, Opportunities, and Threats. The quadrants are colored blue, orange, green, and red, respectively, and contain text placeholders for titles and body text. Each quadrant has a numbered label in the top corners. The central circle has a placeholder for editing text. The overall design is symmetrical, with a clear visual hierarchy emphasizing the central circle and the quadrant titles. Background is white, enhancing the color contrast.
How to Use It
This layout serves as a structured representation of a SWOT analysis, ideal for business presentations. It fits well after a problem-framing slide, providing a visual summary of strengths, weaknesses, opportunities, and threats. This format is useful for strategic planning sessions, team discussions, or stakeholder presentations, allowing for clear communication of key analysis points. It can also be adapted for educational purposes to teach SWOT analysis concepts.
Text Placeholders & Capacity
Keep your copy within these limits so it fits without resizing. Node body slots can hold roughly 15-20 words each.
| Placeholder | Count | Max characters (approx.) |
|---|---|---|
| Slide title | 1 | 30 |
| Item heading | 4 | 15 |
| Item body | 4 | 100 |
| Callout | 1 | 30 |
Slide Keywords
Download unlimited PowerPoint templates, charts and graphics for your presentations with our annual plan.
DOWNLOADReturn to Free SWOT Infographics.