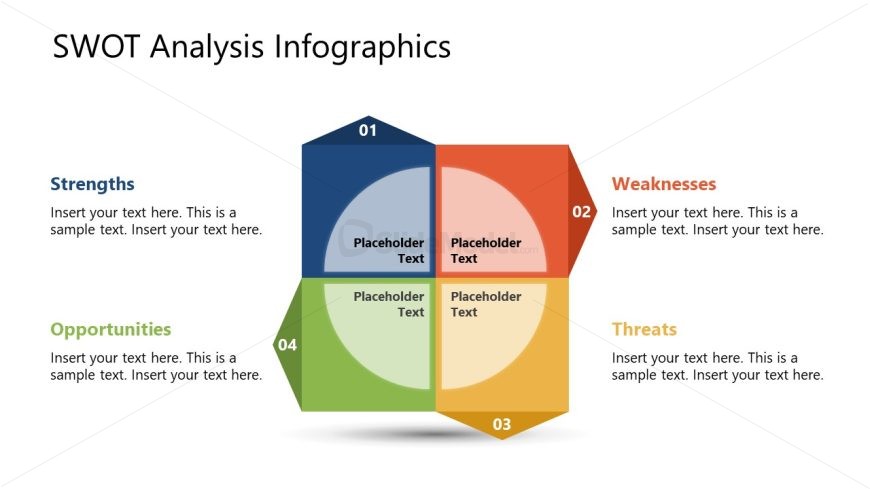
Slide 8 of 26 from Free SWOT Infographics
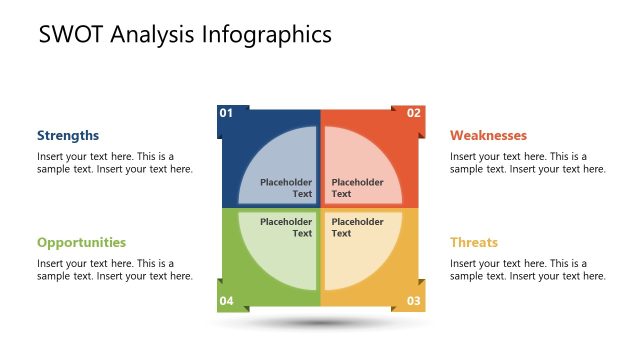
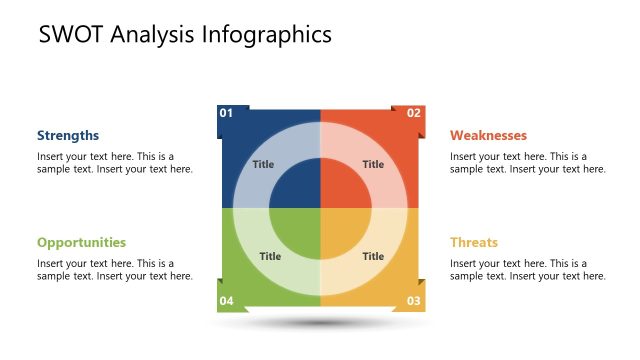
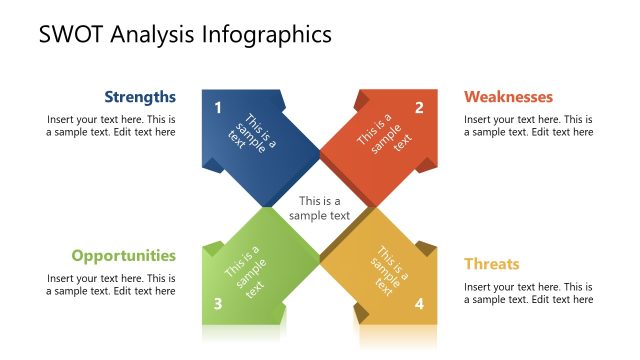
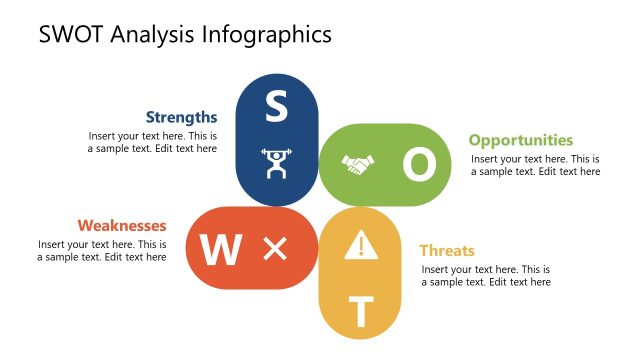
Segmented Square Diagram Slide with Arrows
SWOT Analysis Infographics for Presentations
- Diagram
- Matrix Quadrant
- Strategic Analysis Slide
- 16:9
- 100% Editable
What’s on This Slide
The layout features a hexagonal diagram divided into four sections, each representing a component of a SWOT analysis: Strengths, Weaknesses, Opportunities, and Threats. The sections are color-coded with blue for Strengths, orange for Weaknesses, yellow for Opportunities, and green for Threats. Each section contains a text placeholder aligned to the top left or center, allowing for content insertion. The visual hierarchy emphasizes the labels with larger font sizes. The overall composition is balanced, with a title at the top and placeholders evenly distributed within the hexagon.
How to Use It
This layout serves as a structured SWOT analysis tool, ideal for business presentations. It fits well in a sequence after problem identification and before strategic planning. Use it to summarize strengths, weaknesses, opportunities, and threats in a concise visual format. This slide is suitable for team discussions, strategic planning sessions, or project evaluations, providing a clear overview of internal and external factors impacting an organization.
Text Placeholders & Capacity
Keep your copy within these limits so it fits without resizing. Node body slots can hold roughly 15-20 words each.
| Placeholder | Count | Max characters (approx.) |
|---|---|---|
| Slide title | 1 | 40 |
| Item heading | 4 | 20 |
| Item body | 4 | 100 |
Slide Keywords
Download unlimited PowerPoint templates, charts and graphics for your presentations with our annual plan.
DOWNLOADReturn to Free SWOT Infographics.