Slide 1 of 5 from Free Segmented Quadrants Circular PowerPoint Diagram
Free Segmented Quadrants Circular PowerPoint Diagram
Segmented Quadrants Circular Diagram for Presentations
- Diagram
- Segmented Wheel
- Evaluation Slide
- 16:9
- 100% Editable
What’s on This Slide
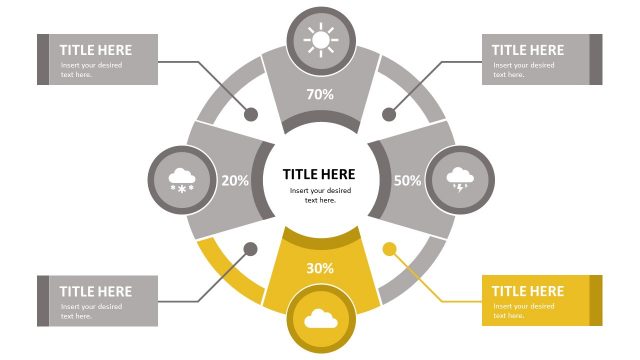
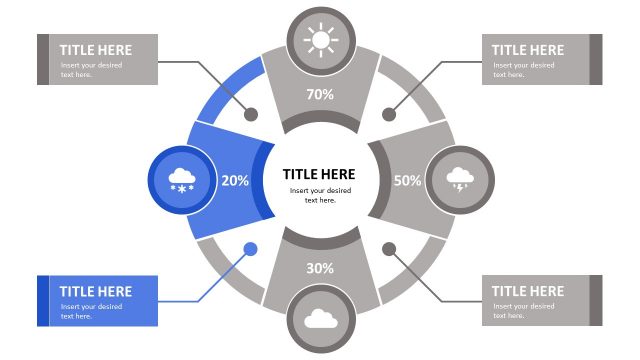
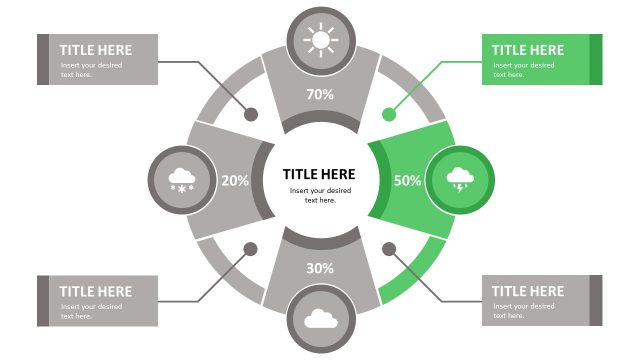
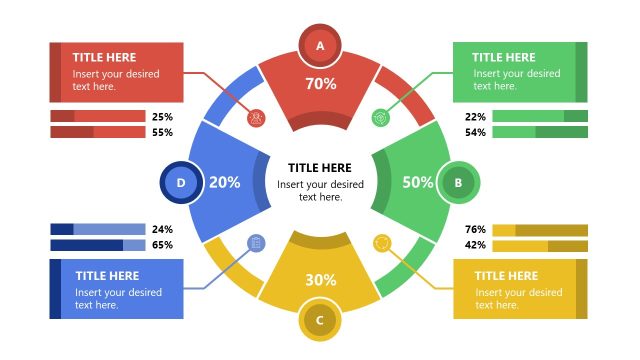
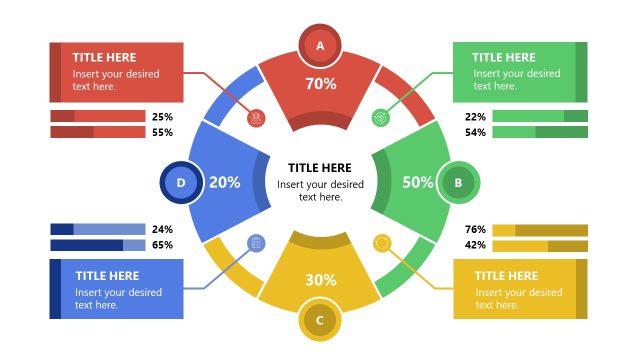
The layout features a circular diagram divided into four segments, each colored differently: red, blue, green, and yellow. Each segment contains a percentage value and a title placeholder positioned at the top. The segments are arranged in a clockwise manner, with connecting lines leading to the central area, which also has a title placeholder. The overall composition is balanced, with a clear visual hierarchy emphasizing the percentage values. Text placeholders are aligned centrally within each segment, while the background remains white, enhancing clarity.
How to Use It
This layout serves as a segmented circular diagram, ideal for displaying comparative data or percentage distributions across four categories. It fits well in presentations that require visualizing data relationships or highlighting key metrics. Suitable scenarios include performance evaluations, project status updates, or market analysis. This structure allows for easy interpretation of data at a glance, making it effective for business presentations and strategic discussions.
Text Placeholders & Capacity
Keep your copy within these limits so it fits without resizing. Node labels can accommodate up to 20 characters each.
| Placeholder | Count | Max characters (approx.) |
|---|---|---|
| Slide title | 1 | 30 |
| Item heading | 4 | 20 |
| Item body | 4 | 30 |
Slide Keywords
Download unlimited PowerPoint templates, charts and graphics for your presentations with our annual plan.
DOWNLOADReturn to Free Segmented Quadrants Circular PowerPoint Diagram.