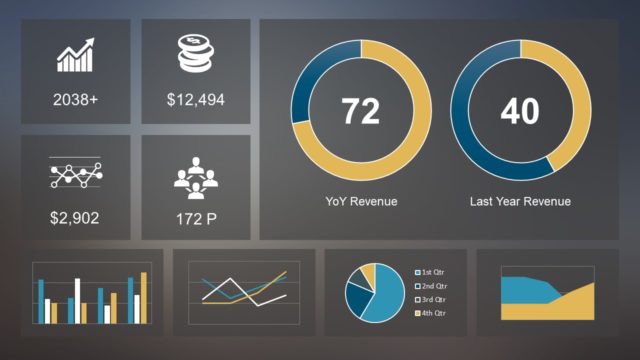
Slide 1 of 3 from Free Sales Management Dashboard PowerPoint Template
Sales and Management Dashboard PowerPoint
Sales Management Dashboard Overview
- Chart
- Dashboard Composite
- Kpi Reporting Slide
- 16:9
- 100% Editable
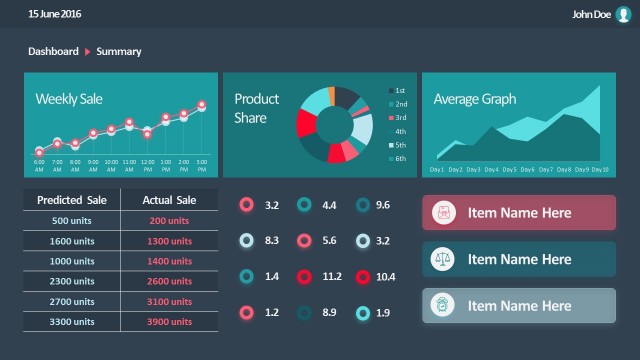
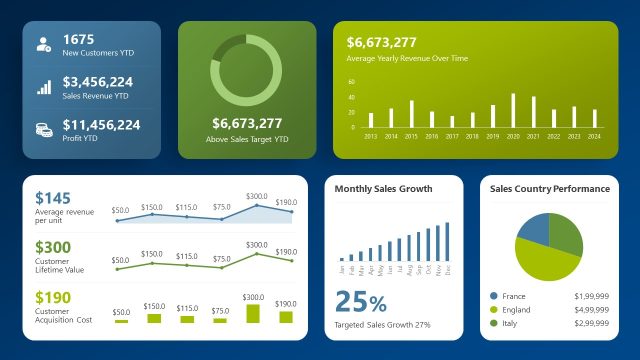
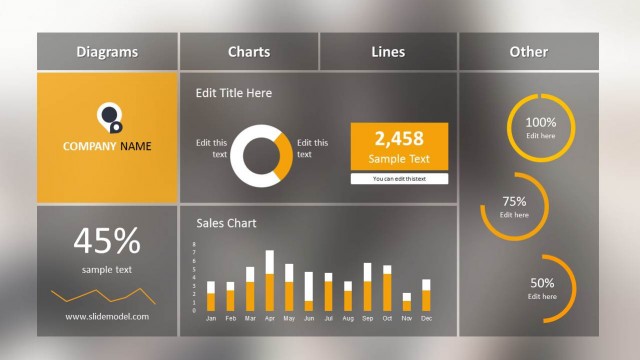
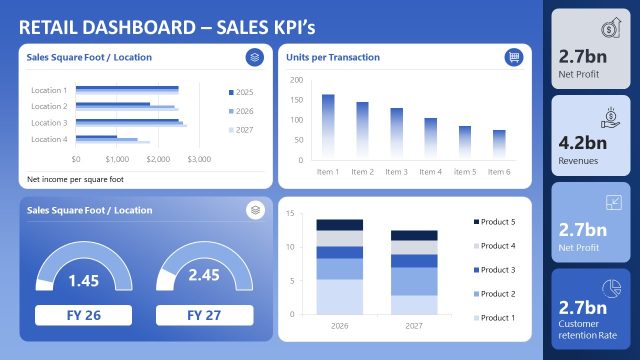
The Sales Management Dashboard slide from the Free Sales Management Dashboard PowerPoint Template offers a clear layout for KPI reporting and sales performance review. This slide template integrates editable shapes and charts, making it suitable for business presentations and quarterly analysis. Its design supports effective visualization of sales metrics through bar and pie charts, enhancing data-driven decision-making in corporate presentations and pitch decks.
What’s on This Slide
The layout features a title at the top center labeled 'Sales Management Dashboard.' Below, there are four columns displaying numerical data, each with a header. A bar chart is positioned beneath the columns, showing performance metrics with four bars in varying heights. To the right, a pie chart illustrates quarterly performance with color-coded segments. Text placeholders are present at the top for additional information. The overall composition is structured with a dark background, enhancing the visibility of the charts and data.
How to Use It
This layout functions as a performance dashboard, ideal for presenting sales metrics and trends. It fits well at the beginning of a presentation to provide an overview of sales data. This structure is useful for business meetings, quarterly reviews, or sales strategy sessions where visual data representation is essential. It allows for quick comparisons and highlights key performance indicators effectively.
Text Placeholders & Capacity
Keep your copy within these limits so it fits without resizing. Node body slots can accommodate short numerical entries, roughly 4 digits each.
| Placeholder | Count | Max characters (approx.) |
|---|---|---|
| Slide title | 1 | 30 |
| Item heading | 4 | 10 |
| Item body | 20 | 4 |
| Chart title | 1 | 30 |
| Callout | 4 | 10 |
Slide Keywords
Download unlimited PowerPoint templates, charts and graphics for your presentations with our annual plan.
DOWNLOADReturn to Free Sales Management Dashboard PowerPoint Template.