Slide 11 of 22 from Free Professional Thesis PowerPoint Templates
Professional Thesis Statistical Analysis PPT
Statistical Analysis Table for Thesis Presentation
- Table
- Data Table
- Evaluation Slide
- 16:9
- 100% Editable
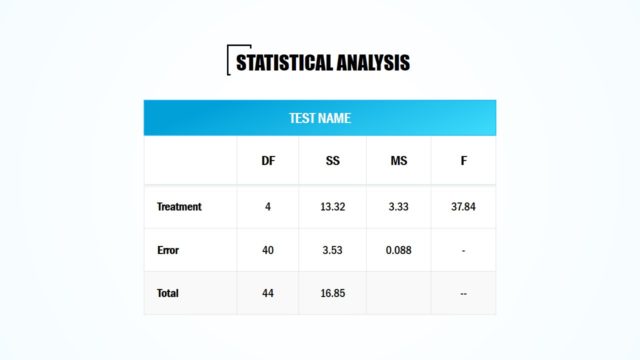
The Statistical Analysis Table slide from the Free Professional Thesis PowerPoint Templates offers a clear layout for presenting complex research data. This slide template is ideal for academic thesis defenses and research presentations, featuring editable slides with a structured table to compare statistical results such as ANOVA or regression analysis. It supports effective communication of data findings within a business presentation or academic context.
What’s on This Slide
The slide features a table positioned centrally, with a header row in dark gray containing four columns labeled DF, SS, MS, and F. Below the header, there are three rows labeled Treatment, Error, and Total, with corresponding numerical values. The table is bordered, and the header row has a distinct color to emphasize it. Text placeholders exist for the title at the top, which is aligned centrally and uses a larger font size. The overall layout is structured and clear, focusing on presenting statistical data.
How to Use It
This layout serves as a data table to present statistical analysis results in a clear format. It fits within a thesis presentation, particularly after sections discussing methodology or results. This structure is useful when detailing statistical tests, such as ANOVA or regression analysis, allowing for easy comparison of values across different tests. It can be used in academic or research settings where data presentation is crucial for understanding findings.
Text Placeholders & Capacity
Keep your copy within these limits so it fits without resizing. Cell slots can hold brief numerical data, roughly 2 characters each.
| Placeholder | Count | Max characters (approx.) |
|---|---|---|
| Slide title | 1 | 30 |
| Column header | 4 | 5 |
| Row label | 3 | 10 |
| Cell | 8 | 2 |
Slide Keywords
Download unlimited PowerPoint templates, charts and graphics for your presentations with our annual plan.
DOWNLOAD