Slide 12 of 22 from Free Professional Thesis PowerPoint Templates
Statistical Analysis Table for Professional Thesis PPT
Statistical Analysis Table for Thesis Presentation
- Table
- Data Table
- Data Findings Slide
- 16:9
- 100% Editable
The Statistical Analysis Table slide from the Free Professional Thesis PowerPoint Templates offers a structured layout for presenting detailed data findings. Designed for academic presentations and thesis defenses, this slide template features editable tables that facilitate clear comparison of statistical results, enhancing the effectiveness of data analysis reports within a professional slide deck.
What’s on This Slide
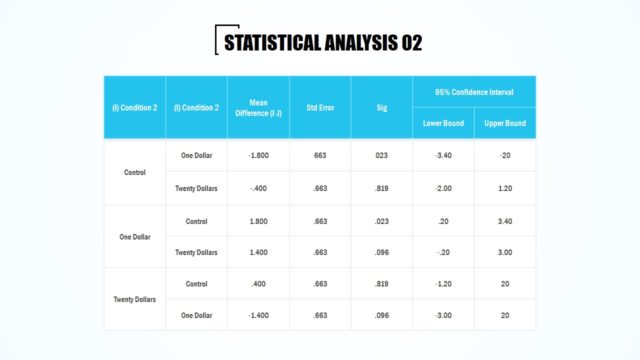
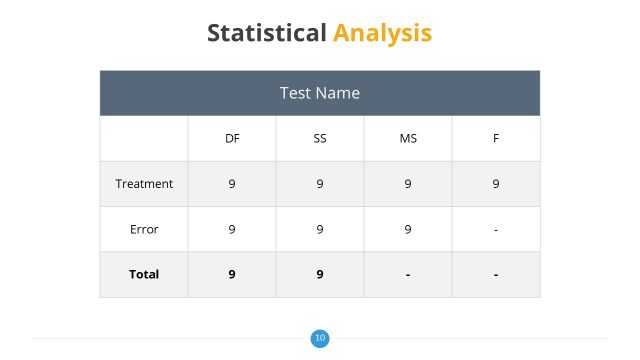
The slide features a table displaying statistical analysis results. It is divided into columns labeled with headers such as 'Condition 2', 'Mean Difference (I-J)', 'Edit Error', 'Sig', and '95% Confidence Interval'. The rows contain data for different conditions including 'Control', '$1 Dollar', and '$20 Dollar'. Each cell contains numerical values, primarily '9'. The table is centrally positioned, with a light background and contrasting header colors for clarity. A title at the top reads 'Statistical Analysis' in bold, emphasizing its importance.
How to Use It
This layout serves to present statistical data in a clear, organized manner. It is suitable for showcasing results in research presentations, particularly in academic or professional contexts. The table format allows for easy comparison of different conditions and their statistical significance. This slide fits well in a sequence following a results summary, providing detailed analysis before concluding remarks. It is ideal for thesis defenses or presentations requiring data-driven insights.
Text Placeholders & Capacity
Keep your copy within these limits so it fits without resizing. Cell slots are tight, roughly 1-2 characters each.
| Placeholder | Count | Max characters (approx.) |
|---|---|---|
| Slide title | 1 | 30 |
| Column header | 6 | 20 |
| Row label | 3 | 15 |
| Cell | 18 | 2 |
Slide Keywords
Download unlimited PowerPoint templates, charts and graphics for your presentations with our annual plan.
DOWNLOAD