Slide 4 of 8 from Free Infographic Flat PowerPoint Template
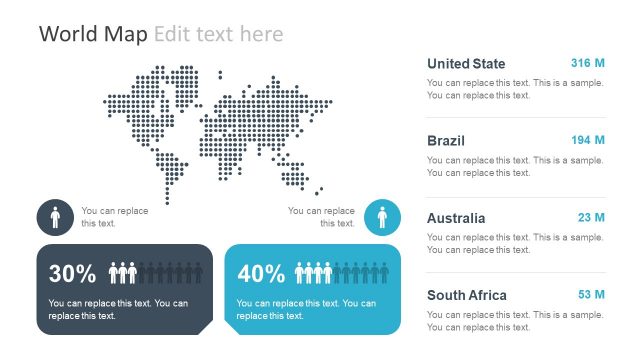
World Map Background with Survey Data
World Map with Data Points for Presentations
- Diagram
- Other
- Evaluation Slide
- 16:9
- 100% Editable
The World Map with Data Points slide from the Free Infographic Flat PowerPoint Template offers a clear and customizable way to visualize geographic data. This slide layout is ideal for business presentations focused on market analysis, demographic studies, or performance metrics, using editable shapes and vector icons to highlight key data points on a world map backdrop.
What’s on This Slide
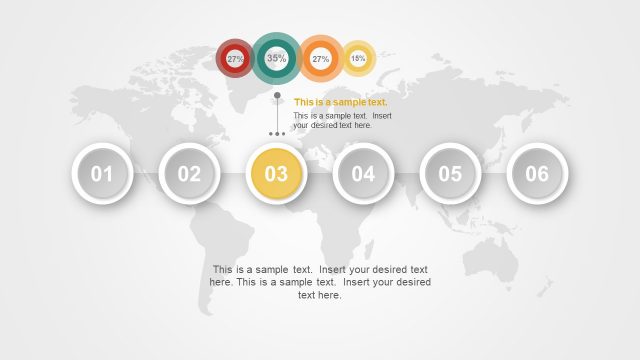
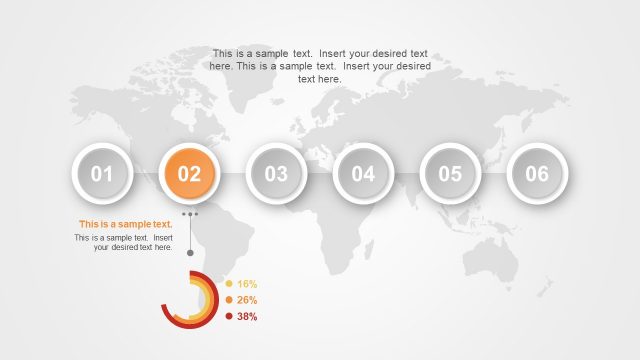
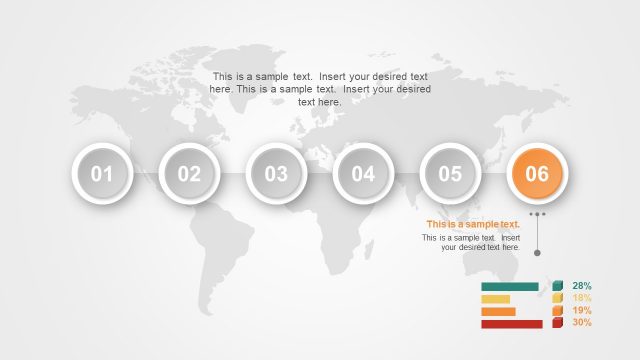
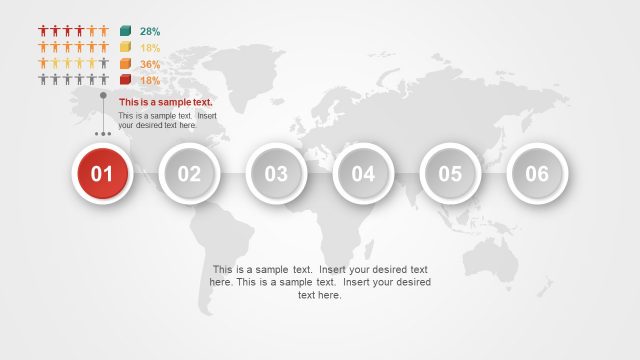
The layout features a world map in a light gray background. Four colored circles represent data points, positioned across different regions of the map. Each circle displays a percentage value, with accompanying text placeholders for descriptions. The circles vary in size, with the largest circle indicating 80% on the left side. Lines connect the circles to their respective text placeholders, which are aligned horizontally. The visual hierarchy emphasizes the data points, while the map serves as a contextual backdrop. The overall composition is balanced with a clear focus on the data.
How to Use It
This layout serves as a visual representation of data distribution across geographical areas, ideal for presentations that require geographical context. It fits well after problem identification slides, providing a transition to data-driven insights. Suitable scenarios include market analysis, demographic studies, or performance metrics across regions. The design allows for easy customization of data points and descriptions, making it versatile for various business contexts.
Text Placeholders & Capacity
Keep your copy within these limits so it fits without resizing. Node text slots can hold about 20-50 characters each.
| Placeholder | Count | Max characters (approx.) |
|---|---|---|
| Item heading | 4 | 20 |
| Item body | 4 | 50 |
Slide Keywords
Download unlimited PowerPoint templates, charts and graphics for your presentations with our annual plan.
DOWNLOADReturn to Free Infographic Flat PowerPoint Template.