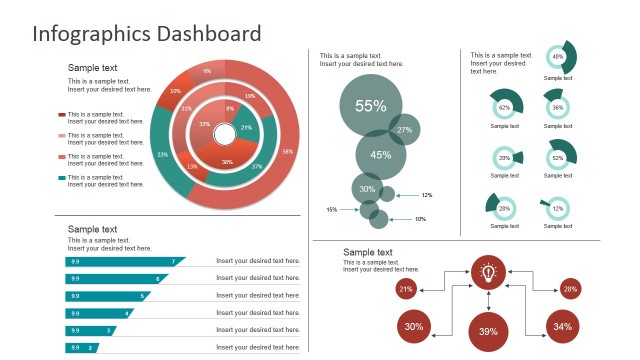
Slide 2 of 5 from Free Coronavirus Dashboard Template for PowerPoint
COVID 19 Dashboard PowerPoint
COVID-19 Dashboard Overview for Presentations
- Chart
- Dashboard Composite
- Context Slide
- 16:9
- 100% Editable
The COVID-19 Dashboard Overview slide from the Free Coronavirus Dashboard Template for PowerPoint offers a clear layout for presenting pandemic data. This slide template includes editable shapes and vector icons to visualize confirmed cases, deaths, recoveries, and trends effectively. Ideal for health briefings and business presentations, it integrates well into a slide deck focused on public health updates with concise, data-driven insights.
What’s on This Slide
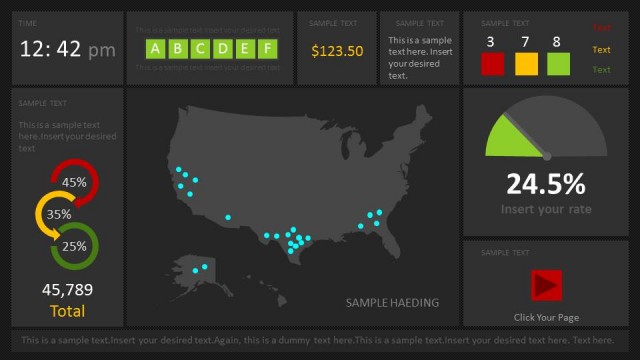
The layout features a dark background with various sections. The top left displays the current time in large font. To the right, there are placeholders for text with a sample heading. Below, a map of the United States shows orange circles indicating data points. The left side includes statistics for confirmed cases, deaths, and recoveries, each with a corresponding label. A gauge chart on the right indicates a percentage rate. Additional sample text placeholders are present at the bottom for further data. The overall structure is organized into distinct areas for clarity.
How to Use It
This layout serves as a comprehensive dashboard for presenting COVID-19 data. It is suitable for summarizing key statistics and visualizing trends in a presentation. This slide fits well after an introductory slide, providing a detailed overview of the current situation. It can be used in health briefings, public health presentations, or business meetings discussing pandemic impacts. The layout allows for quick data interpretation, making it ideal for audiences needing concise information.
Text Placeholders & Capacity
Keep your copy within these limits so it fits without resizing. Body slots are tight, roughly 10-15 words each.
| Placeholder | Count | Max characters (approx.) |
|---|---|---|
| Slide title | 1 | 30 |
| Body paragraph | 5 | 50 |
| Item heading | 3 | 20 |
| Item body | 3 | 30 |
| Chart title | 1 | 20 |
Slide Keywords
Download unlimited PowerPoint templates, charts and graphics for your presentations with our annual plan.
DOWNLOADReturn to Free Coronavirus Dashboard Template for PowerPoint.