Slide 7 of 7 from Free Circular Segmented Infographic Pie Chart for PowerPoint
Infographic Pie Chart Arrow Step 6 PowerPoint
Circular Segmented Infographic Pie Chart for Presentations
- Diagram
- Segmented Wheel
- Process Slide
- 16:9
- 100% Editable
The Circular Segmented Infographic Pie Chart slide from the Free Circular Segmented Infographic Pie Chart for PowerPoint template offers a clear visual process representation ideal for business presentations. This slide template features editable shapes and vector icons arranged around a central pie chart, making it suitable for presenting statistical analysis and project overviews within a professional slide deck.
What’s on This Slide
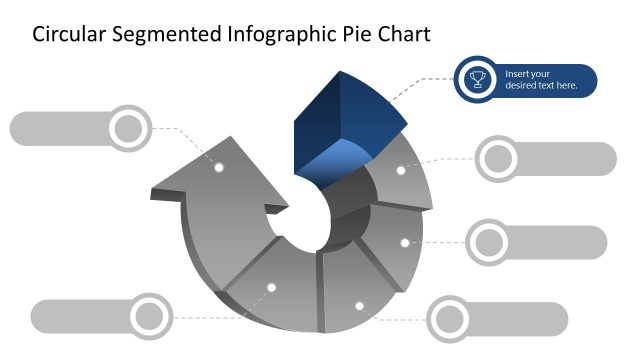
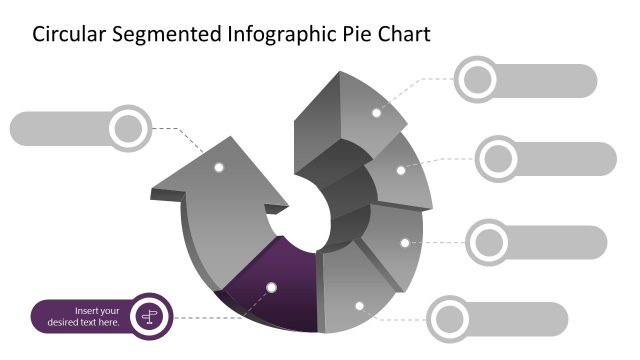
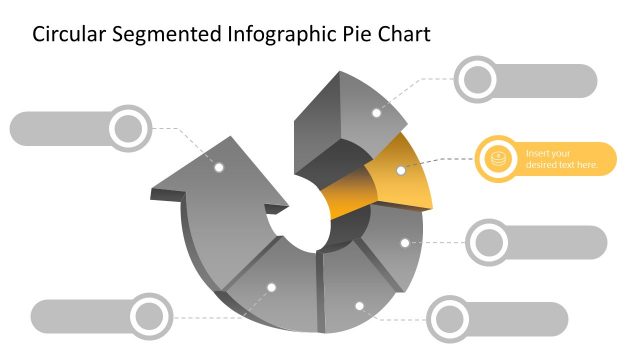
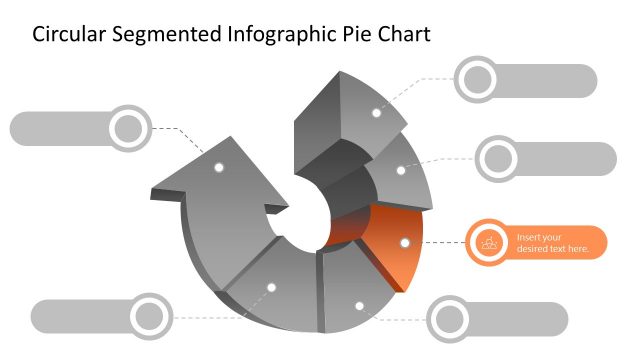
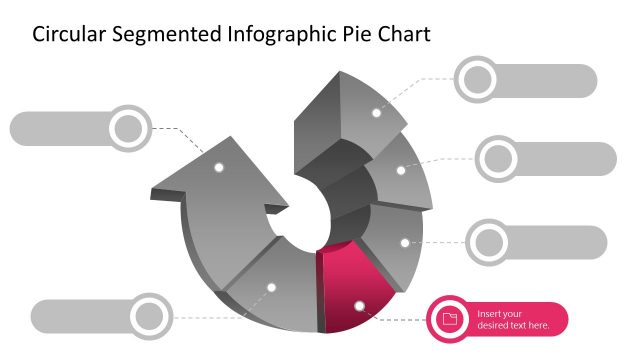
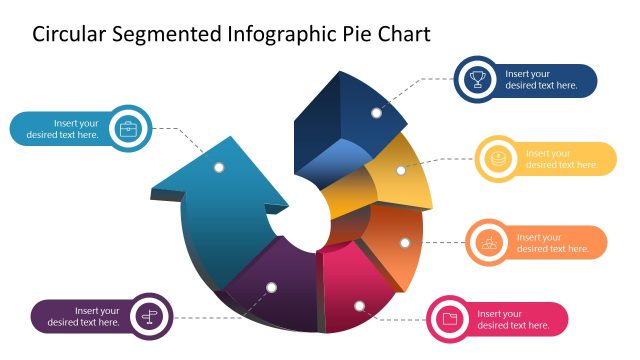
The layout features a circular segmented pie chart positioned centrally, with an upward-pointing arrow in blue. The chart consists of several gray segments that are visually distinct. To the left of the chart, there is a text placeholder labeled 'Insert your desired text here,' which is aligned horizontally. Additional circular placeholders are arranged vertically on the right side, each connected by dashed lines. The overall composition emphasizes the central pie chart while providing space for accompanying text, creating a clear visual hierarchy.
How to Use It
This layout serves as a segmented infographic for presenting data or concepts in a circular format. It is suitable for illustrating parts of a whole, making it ideal for business presentations that require visual representation of statistics or project components. This slide fits well in a sequence that introduces a concept followed by detailed explanations or data points, enhancing audience understanding through visual aids.
Text Placeholders & Capacity
Keep your copy within these limits so it fits without resizing. Node body slots can accommodate roughly 5-6 words each.
| Placeholder | Count | Max characters (approx.) |
|---|---|---|
| Slide title | 1 | 40 |
| Item body | 6 | 30 |
| Body paragraph | 1 | 50 |
Slide Keywords
Download unlimited PowerPoint templates, charts and graphics for your presentations with our annual plan.
DOWNLOADReturn to Free Circular Segmented Infographic Pie Chart for PowerPoint.