Slide 2 of 7 from Free Circular Segmented Infographic Pie Chart for PowerPoint
Infographic Pie Chart Arrow Step 1 PowerPoint
Circular Segmented Infographic Pie Chart for Presentations
- Diagram
- Segmented Wheel
- Evaluation Slide
- 16:9
- 100% Editable
The Circular Segmented Infographic Pie Chart slide from the Free Circular Segmented Infographic Pie Chart for PowerPoint template offers a clear visual tool for market analysis and project breakdown discussions. This slide layout uses editable shapes and vector icons to highlight performance metrics effectively, making it a practical choice for business presentations requiring precise data visualization within a slide deck.
What’s on This Slide
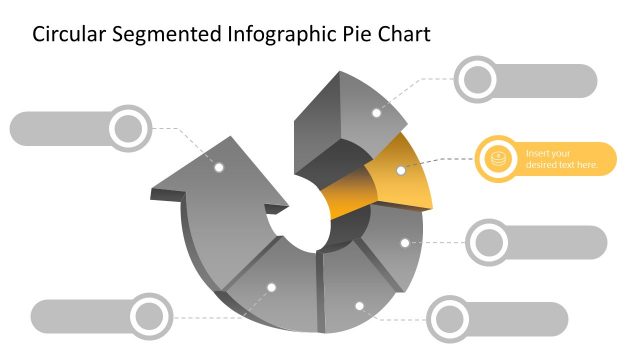
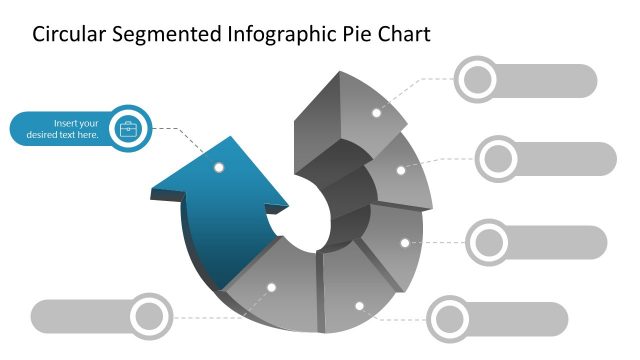
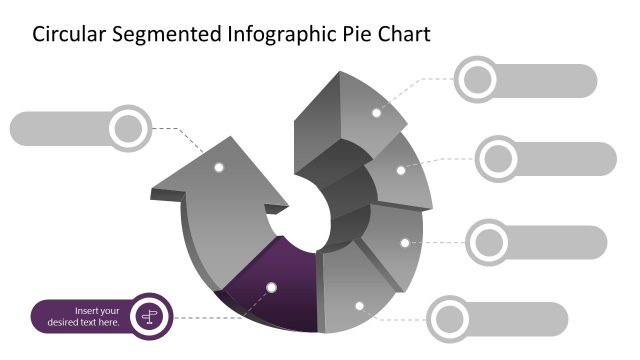
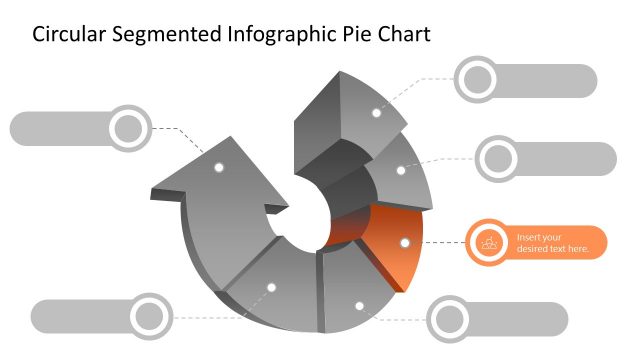
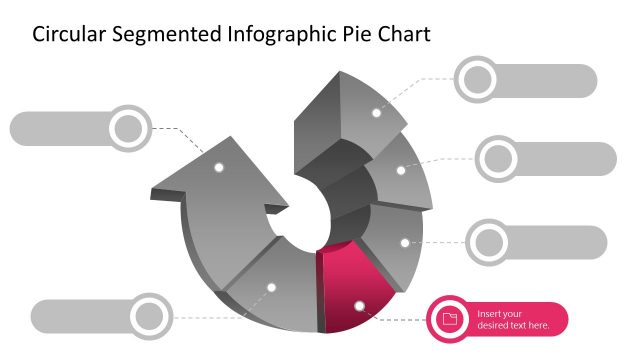
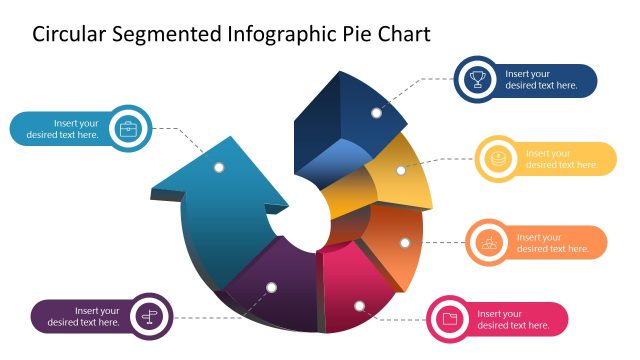
The layout features a circular segmented pie chart positioned centrally, with a prominent blue 3D segment at the top. Surrounding the chart are four gray circular placeholders, each connected by dashed lines to the pie chart. The placeholders are evenly spaced around the chart, allowing for text insertion. A title is placed at the top, indicating the slide's subject. The overall composition is balanced, with a clear visual hierarchy emphasizing the central pie chart and its segments. Background colors are neutral, enhancing the chart's visibility.
How to Use It
This layout serves as a visual representation of segmented data, ideal for showcasing proportions or categories within a whole. It fits well in presentations discussing market analysis, project breakdowns, or performance metrics. The structure allows for clear comparisons among segments, making it suitable for business scenarios where data visualization is crucial. It can be used to illustrate survey results, budget allocations, or product features in a concise manner, enhancing audience understanding of complex information.
Text Placeholders & Capacity
Keep your copy within these limits so it fits without resizing. Node slots can hold concise text, roughly 5-6 words each.
| Placeholder | Count | Max characters (approx.) |
|---|---|---|
| Slide title | 1 | 40 |
| Item body | 4 | 30 |
Slide Keywords
Download unlimited PowerPoint templates, charts and graphics for your presentations with our annual plan.
DOWNLOADReturn to Free Circular Segmented Infographic Pie Chart for PowerPoint.