Slide 4 of 7 from Free Circular Segmented Infographic Pie Chart for PowerPoint
Infographic Pie Chart Arrow Step 3 PowerPoint
Circular Segmented Infographic Pie Chart Template
- Diagram
- Circular Cycle
- Process Slide
- 16:9
- 100% Editable
The Circular Segmented Infographic Pie Chart slide from the Free Circular Segmented Infographic Pie Chart for PowerPoint template offers a clear visual process representation using editable shapes and vector icons. This slide template is suitable for business presentations and project updates, providing a structured layout to present segmented data effectively within a corporate presentation or marketing report slide deck.
What’s on This Slide
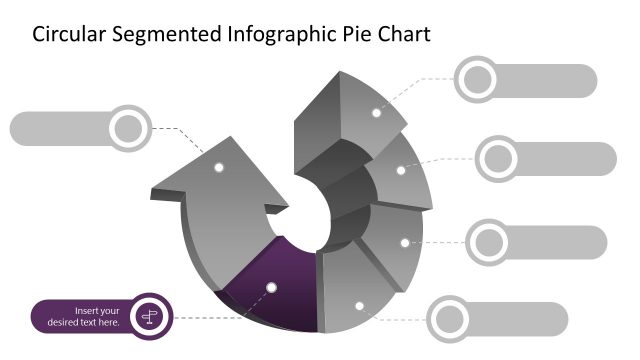
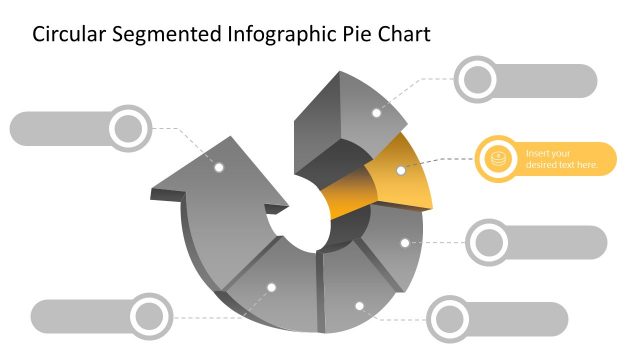
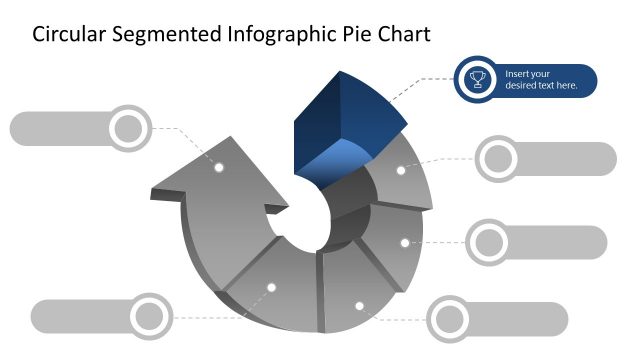
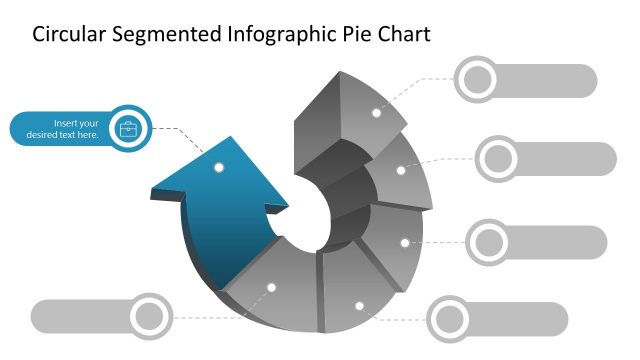
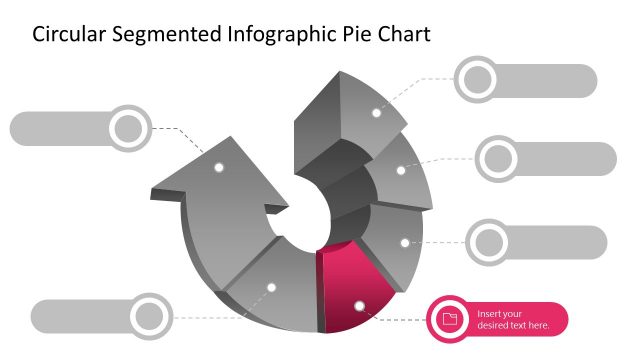
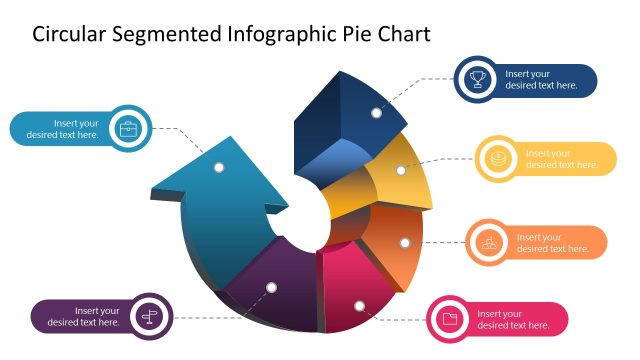
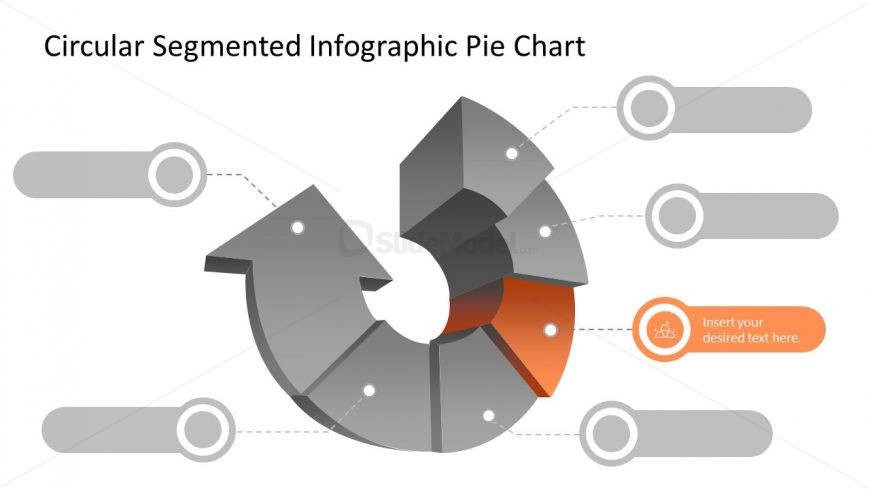
The layout features a circular segmented pie chart positioned centrally, with segments in varying shades of gray and one segment highlighted in orange. Surrounding the chart are five circular placeholders aligned horizontally, each connected by dashed lines. The placeholders are designed for text insertion, with one prominently displaying 'Insert your desired text here.' The overall composition emphasizes the central pie chart, with a clean and organized visual hierarchy. The background is light, enhancing the visibility of the chart and placeholders.
How to Use It
This layout serves as a segmented infographic pie chart, ideal for illustrating data distributions or comparisons. It fits well in presentations that require visual data representation, such as marketing reports or project updates. The surrounding placeholders allow for additional context or explanations related to each segment. This structure is effective for business scenarios where clear visual communication of data is essential, such as stakeholder presentations or team briefings.
Text Placeholders & Capacity
Keep your copy within these limits so it fits without resizing. Node body slots can hold about 30 characters each.
| Placeholder | Count | Max characters (approx.) |
|---|---|---|
| Item body | 5 | 30 |
| Slide title | 1 | 40 |
Slide Keywords
Download unlimited PowerPoint templates, charts and graphics for your presentations with our annual plan.
DOWNLOADReturn to Free Circular Segmented Infographic Pie Chart for PowerPoint.