Slide 1 of 7 from Free Circular Segmented Infographic Pie Chart for PowerPoint
Circular Arrow Pie Chart PowerPoint
Circular Segmented Infographic Pie Chart Template
- Diagram
- Segmented Wheel
- Process Slide
- 16:9
- 100% Editable
The Circular Segmented Infographic Pie Chart slide from the Free Circular Segmented Infographic Pie Chart for PowerPoint template offers a clear visual tool for market analysis and budget allocation. This slide layout uses editable shapes and vector icons arranged in a segmented wheel format, making it suitable for business presentations and pitch deck templates that require detailed feature comparisons or process breakdowns.
What’s on This Slide
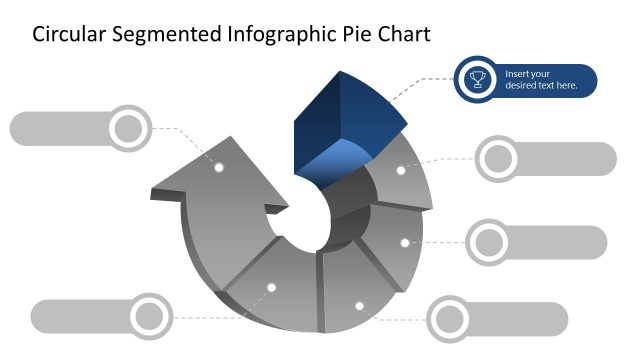
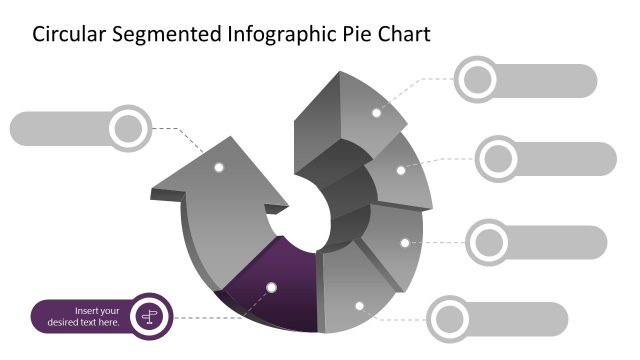
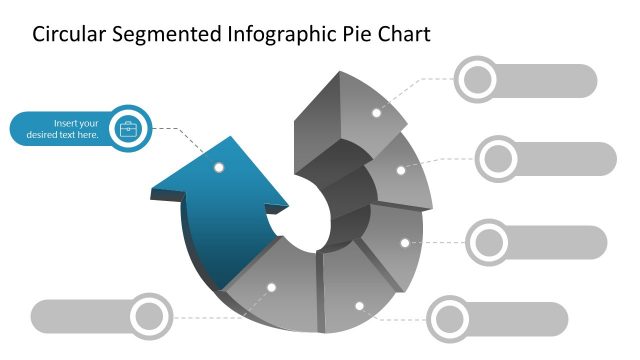
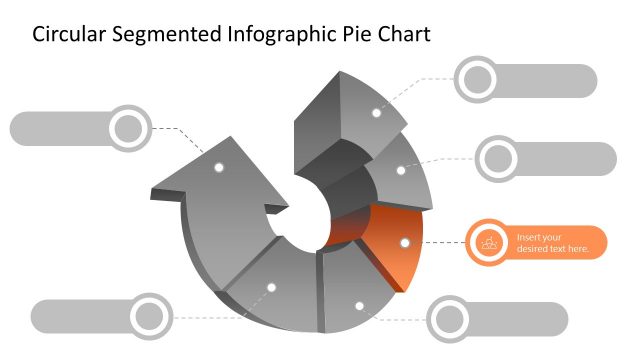
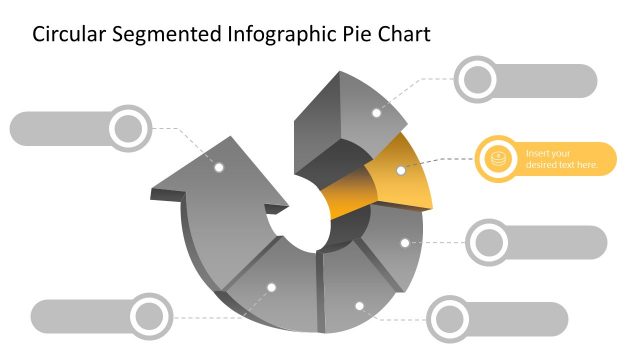
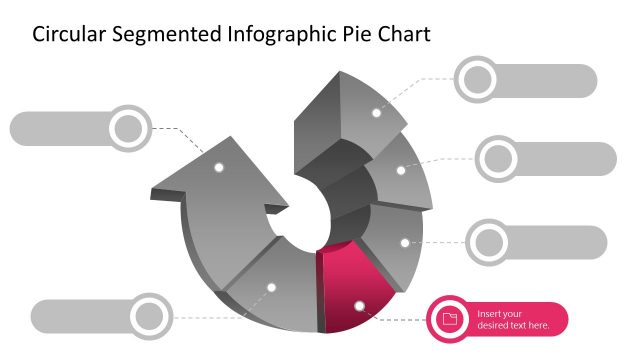
The layout features a circular segmented pie chart positioned centrally. The chart has six distinct segments, each in a different color, arranged in a clockwise direction. Each segment has a corresponding circular icon placed to the left or right, connected by dashed lines. Text placeholders are located within each segment and next to each icon, aligned to the left. The title is positioned at the top center, with a bold font. The overall composition is balanced, with clear visual hierarchy and color differentiation among segments.
How to Use It
This layout serves as a segmented infographic pie chart, ideal for presenting data in a visually engaging manner. It fits well in presentations that require a breakdown of categories or components, such as market analysis or project phases. This structure is useful for business scenarios like product feature comparisons or budget allocations, allowing for clear communication of segmented information. It can be used effectively in both introductory and summary sections of a presentation.
Text Placeholders & Capacity
Keep your copy within these limits so it fits without resizing. Node body slots can hold roughly 5-6 words each.
| Placeholder | Count | Max characters (approx.) |
|---|---|---|
| Slide title | 1 | 30 |
| Item body | 6 | 30 |
| Item heading | 6 | 30 |
Slide Keywords
Download unlimited PowerPoint templates, charts and graphics for your presentations with our annual plan.
DOWNLOADReturn to Free Circular Segmented Infographic Pie Chart for PowerPoint.