Slide 8 of 8 from Free Business Plan Slides for PowerPoint
Free Business Plan PowerPoint Diagram
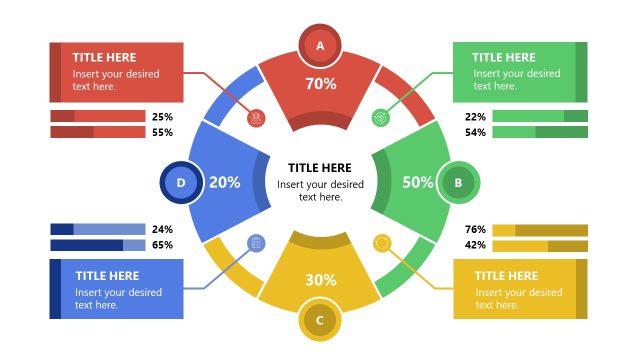
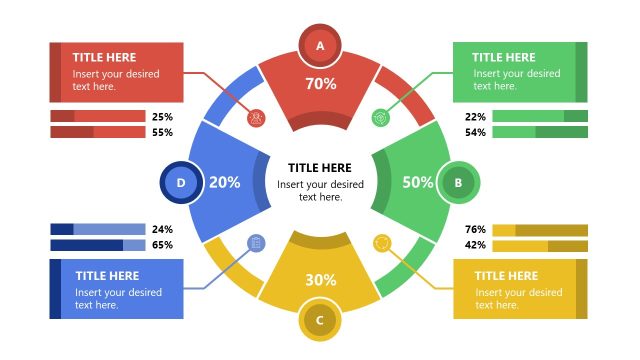
Circular Percentage Diagram for Business Plans
- Diagram
- Circular Cycle
- Evaluation Slide
- 16:9
- 100% Editable
The Circular Percentage Diagram slide from the Free Business Plan Slides for PowerPoint template offers a clear visual format for presenting performance metrics and survey results. This slide layout uses editable shapes and a balanced circular design to highlight key statistics, making it suitable for business presentations and pitch deck templates that require concise data evaluation and project summaries.
What’s on This Slide
The layout features a circular diagram at the center with four percentage indicators positioned around it. Each percentage is accompanied by a numbered label, indicating distinct segments. Text placeholders are located adjacent to each percentage, aligned to the left or right, providing space for descriptive content. The overall design employs a color gradient in the circular shape, while the background remains neutral. The visual hierarchy emphasizes the percentages, making them the focal point. The diagram is symmetrical, contributing to a balanced composition.
How to Use It
This layout serves as a visual representation of comparative data or performance metrics. It is suitable for summarizing key statistics in business presentations, such as project progress or market analysis. Positioned towards the end of a presentation, it can effectively highlight results or conclusions. This structure is beneficial in scenarios where quick visual comprehension of data is essential, such as stakeholder meetings or strategic reviews. It can also be used to illustrate survey results or performance evaluations.
Text Placeholders & Capacity
Keep your copy within these limits so it fits without resizing. Node body slots can hold around 10 words each.
| Placeholder | Count | Max characters (approx.) |
|---|---|---|
| Item heading | 4 | 20 |
| Item body | 4 | 50 |
Slide Keywords
Download unlimited PowerPoint templates, charts and graphics for your presentations with our annual plan.
DOWNLOADReturn to Free Business Plan Slides for PowerPoint.