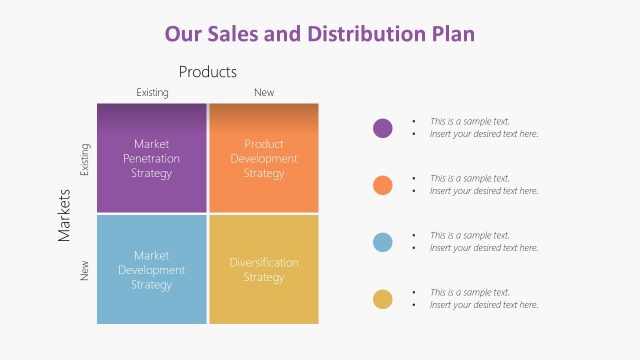
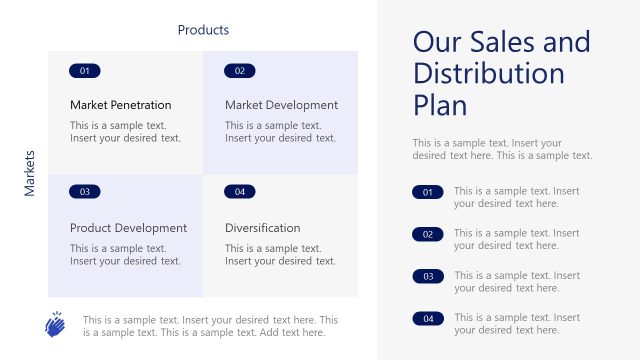
Slide 3 of 5 from Free Business Plan Diagrams PowerPoint Templates
Hierarchy Diagram of Process Model
Sales Distribution Diagram for Business Plans
- Diagram
- Arrow Sequence
- Process Slide
- 16:9
- 100% Editable
The Sales Distribution Diagram slide from the Free Business Plan Diagrams PowerPoint Templates offers a clear visual representation of supply chain roles and distribution strategies. This editable slide uses connected hexagons and vector icons to illustrate business processes, making it suitable for corporate presentations and pitch deck templates focused on sales flow and operational planning.
What’s on This Slide
The layout features a central hexagon labeled 'SALES DISTRIBUTION' at the top. Below, five hexagons are arranged in a horizontal line, each representing different roles: MANUFACTURER, DISTRIBUTOR, RETAILER, FACTORY, and MAJOR CHAIN. Each hexagon contains an icon, with text placeholders below them for descriptions. The hexagons are connected by dotted lines, indicating a flow or relationship. The color scheme transitions from light to dark purple, enhancing visual hierarchy, while the background remains white, providing contrast.
How to Use It
This layout serves as a flowchart to illustrate the sales distribution process in a business context. It fits well in a presentation sequence following problem identification and before strategic planning. This structure is useful for explaining roles in a supply chain or distribution network, making it ideal for business plans, marketing strategies, or operational overviews. It can effectively communicate how different entities contribute to sales distribution.
Text Placeholders & Capacity
Keep your copy within these limits so it fits without resizing. Node body slots can hold about 15-20 words each.
| Placeholder | Count | Max characters (approx.) |
|---|---|---|
| Slide title | 1 | 30 |
| Item heading | 5 | 20 |
| Item body | 5 | 80 |
Slide Keywords
Download unlimited PowerPoint templates, charts and graphics for your presentations with our annual plan.
DOWNLOAD