Slide 8 of 9 from Free Animated Editable Professional Infographics PowerPoint Template
Editable World Map Template
World Map with Data Indicators Slide
- Map
- World Map
- Data Findings Slide
- 16:9
- 100% Editable
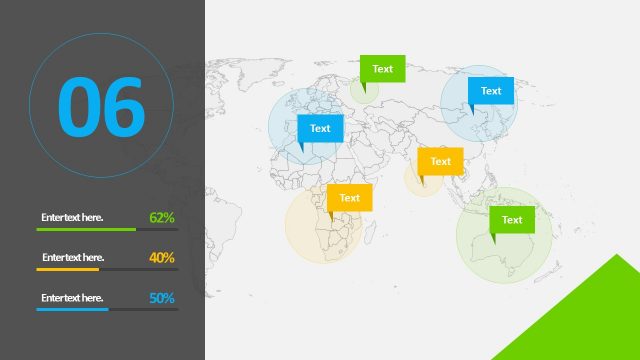
The World Map with Data Indicators slide from the Free Animated Editable Professional Infographics PowerPoint Template offers a clear way to present geographical data and regional performance metrics. This slide layout integrates editable shapes and progress bars on a world map background, making it ideal for corporate presentations or business presentation slide decks that require visualizing survey results or key data findings across multiple regions.
What’s on This Slide
The slide features a world map centered in the background, with a dark blue left section containing a large yellow number '06' at the top. Below this number, there are three horizontal text placeholders, each accompanied by a colored progress bar indicating percentages. The map displays several circular regions in varying colors, each containing a text placeholder. The circles are semi-transparent, allowing the map to remain visible. The overall layout is structured with a clear visual hierarchy, emphasizing the number and progress indicators.
How to Use It
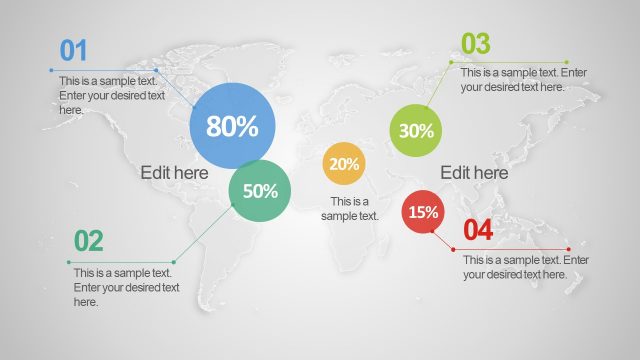
This layout serves as a visual representation of data across different geographical locations. It is suitable for illustrating statistics or performance metrics related to specific regions. In a presentation, it can be used to highlight key performance indicators or survey results. This slide fits well in a sequence following a problem statement, leading into a discussion of solutions or strategies based on the presented data.
Text Placeholders & Capacity
Keep your copy within these limits so it fits without resizing. Body slots can accommodate roughly 3-5 words each.
| Placeholder | Count | Max characters (approx.) |
|---|---|---|
| Slide title | 1 | 20 |
| Item heading | 6 | 10 |
| Body paragraph | 3 | 30 |
Slide Keywords
Download unlimited PowerPoint templates, charts and graphics for your presentations with our annual plan.
DOWNLOADReturn to Free Animated Editable Professional Infographics PowerPoint Template.