Slide 20 of 29 from #2 Maps Bundle PowerPoint Template
30011-01-maps-bundle-powerpoint-19
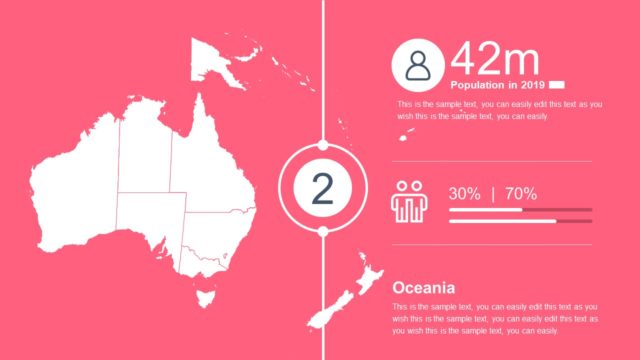
Oceania Map with Population Analysis
- Map
- Country Map
- Context Slide
- 16:9
- 100% Editable
The Oceania Map with Population Data slide from the #2 Maps Bundle PowerPoint Template offers a clear regional demographic analysis using editable slides. It combines a detailed map of Oceania with population statistics and visual bar graphs, making it suitable for business presentations focused on market entry strategies and population trends.
What’s on This Slide
The slide features a large map of Oceania, prominently displaying Australia. The map is positioned on the right side, with a population analysis section on the left. This section includes a bold statistic reading '80%' at the top, indicating the population percentage. Below this, a series of horizontal bar graphs represent various demographic percentages, with colored bars and labels. A central statistic of '685k' is highlighted, indicating a population figure. Icons for male and female users are included at the bottom, along with their respective percentages.
How to Use It
This layout serves to present geographic and demographic information effectively. It is suitable for discussions on regional population statistics, market analysis, or demographic trends. The slide fits well in a presentation sequence following an overview of geographic markets, allowing for a detailed examination of a specific region. It can be used in business contexts, such as market entry strategies or demographic profiling.
Text Placeholders & Capacity
Keep your copy within these limits so it fits without resizing. Body slots are tight, roughly 10-15 words each.
| Placeholder | Count | Max characters (approx.) |
|---|---|---|
| Slide title | 1 | 30 |
| Body paragraph | 1 | 150 |
| Item heading | 6 | 10 |
| Item body | 6 | 10 |
| Kpi value | 1 | 10 |
| Kpi caption | 1 | 10 |
Slide Keywords
Download unlimited PowerPoint templates, charts and graphics for your presentations with our annual plan.
DOWNLOADReturn to #2 Maps Bundle PowerPoint Template.