Slide 8 of 32 from #2 Editable Data Driven Maps Bundle
Pixelated Map for Sales Analysis PowerPoint
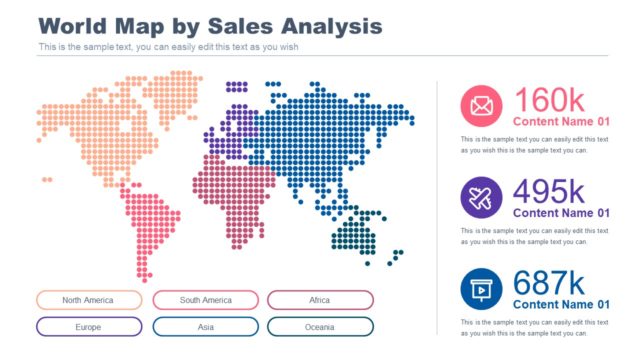
World Map by Sales Analysis Slide
- Map
- World Map
- Evaluation Slide
- 16:9
- 100% Editable
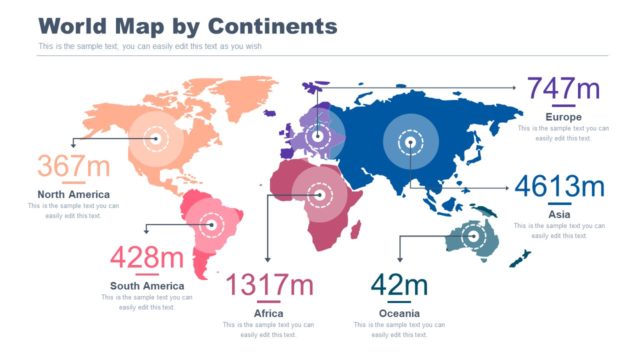
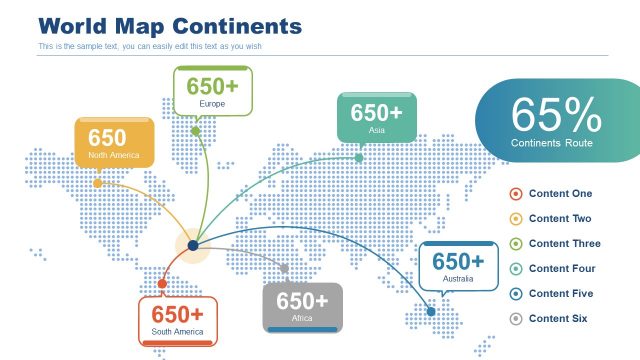
The World Map by Sales Analysis slide from the #2 Editable Data Driven Maps Bundle offers a clear geographic visualization ideal for business presentations and market analysis. This slide template uses color-coded dots and vector icons to highlight regional sales performance, making it a practical choice for corporate presentations and pitch deck templates focused on demographic insights and sales strategy.
What’s on This Slide
The slide features a world map composed of colored dots representing different regions, including North America, South America, Europe, Asia, Africa, and Oceania. Each region is visually distinct, with a color-coded legend below the map. On the right side, three data points are displayed in circular icons, each accompanied by sample text placeholders. The title is positioned at the top, with a larger font size, while the subtitle is smaller and located directly below. The overall layout is balanced, with clear visual hierarchy and grouping of elements.
How to Use It
This layout serves as a geographic data visualization, ideal for presenting sales analysis across different continents. It fits well within a presentation focused on market performance or demographic insights. This structure can be utilized in business scenarios such as sales strategy discussions, market entry analysis, or regional performance reviews. It effectively communicates data in a visually engaging manner, making it suitable for reports and presentations aimed at stakeholders or decision-makers.
Text Placeholders & Capacity
Keep your copy within these limits so it fits without resizing. Node labels can hold about 2-3 words each, while body slots can accommodate roughly 15-20 words.
| Placeholder | Count | Max characters (approx.) |
|---|---|---|
| Slide title | 1 | 30 |
| Subtitle | 1 | 100 |
| Item heading | 6 | 20 |
| Item body | 3 | 100 |
Slide Keywords
Download unlimited PowerPoint templates, charts and graphics for your presentations with our annual plan.
DOWNLOADReturn to #2 Editable Data Driven Maps Bundle.