Slide 32 of 32 from #2 Editable Data Driven Maps Bundle
Data Driven Heat Maps Bundle in PowerPoint
Data Driven Heat Maps for Geographic Analysis
- Media Layout
- Other
- Context Slide
- 16:9
- 100% Editable
The Data Driven Heat Maps slide from the #2 Editable Data Driven Maps Bundle offers a clear layout for geographic data presentation, featuring editable shapes and vector icons representing key global regions. Ideal for corporate presentations and business slide decks, this slide template supports demographic analysis and regional reporting with a professional design suitable for PowerPoint and Google Slides templates.
What’s on This Slide
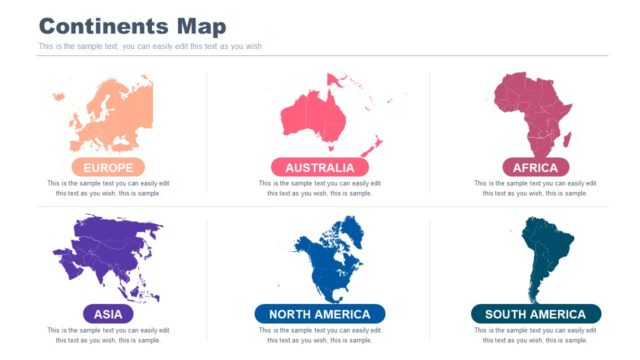
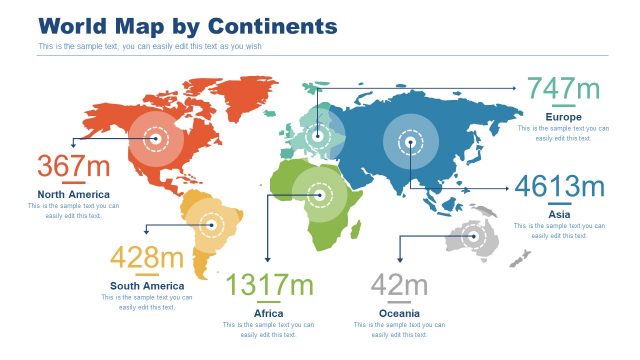
The layout features a title at the top center reading 'Data Driven Heat Maps.' Below, there are eight square icons arranged in a grid format, each representing different geographic regions: Europe, USA, Africa, China, Asia, North America, South America, and Australia. Each icon is accompanied by a label indicating the region it represents. The icons are uniformly sized and aligned, with the labels positioned directly below each icon. The overall color scheme includes shades of blue, orange, green, and gray, creating a clear visual hierarchy and organization.
How to Use It
This layout serves as a summary slide for presenting various data-driven heat maps related to different geographic regions. It fits well towards the end of a presentation, summarizing key areas of focus. This structure is useful for analysts and presenters who need to highlight specific regions in demographic or geographic reports. It can also be used to introduce detailed data analysis slides that follow, making it suitable for business contexts involving geographic data presentation.
Text Placeholders & Capacity
Keep your copy within these limits so it fits without resizing. Node labels can hold about 2-3 words each.
| Placeholder | Count | Max characters (approx.) |
|---|---|---|
| Slide title | 1 | 30 |
| Item heading | 8 | 15 |
Slide Keywords
Download unlimited PowerPoint templates, charts and graphics for your presentations with our annual plan.
DOWNLOADReturn to #2 Editable Data Driven Maps Bundle.