Slide 13 of 20 from Data Lineage PowerPoint Template
Editable Data Risk Heatmap Matrix PPT Template
Data Risk Heatmap for Business Analysis
- Chart
- Heatmap
- Risk Assessment Slide
- 16:9
- 100% Editable
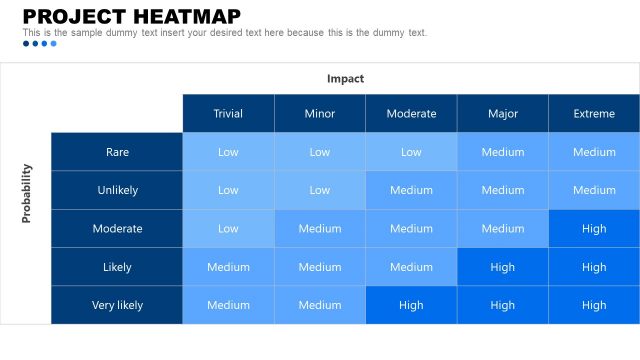
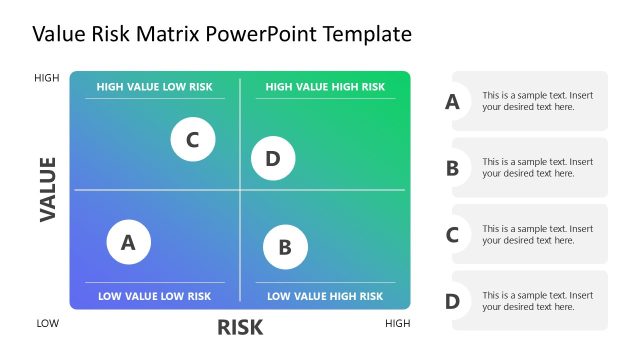
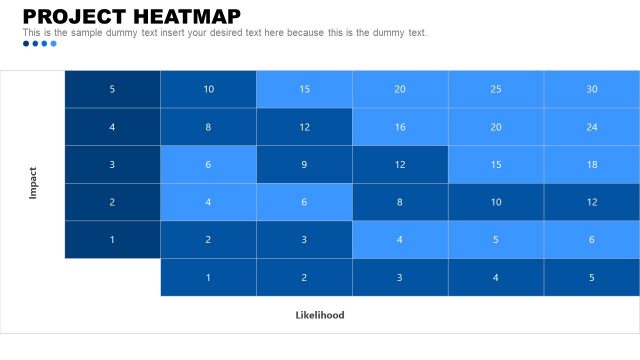
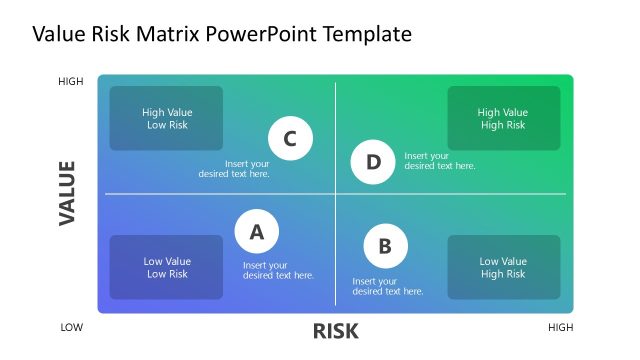
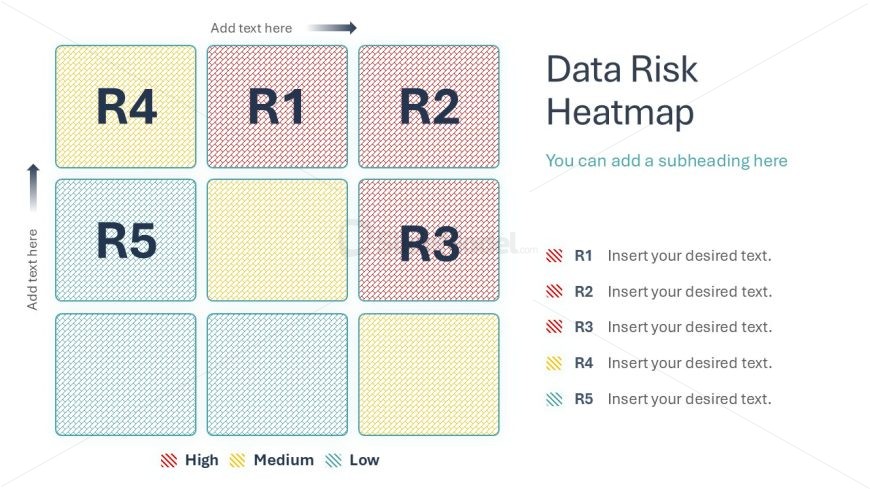
The Data Risk Heatmap slide from the Data Lineage PowerPoint Template offers a clear visual tool for risk assessment using a 3x3 grid with color-coded risk levels. This slide layout is designed for business presentations focused on data governance and risk management, featuring editable shapes and vector icons to enhance clarity. It integrates seamlessly into slide decks addressing data quality, helping stakeholders prioritize risks effectively within corporate presentation settings.
What’s on This Slide
The layout features a 3x3 grid of colored squares representing data risk levels. The top row contains three squares labeled R1, R2, and R3, with R1 highlighted in red. The middle row has squares labeled R4, R5, and R3, with R4 in yellow. The bottom row includes R5, R2, and R1, with R5 in blue. Each square has a placeholder for text, and the grid is accompanied by a title and a subheading on the right. The overall color scheme includes red, yellow, and blue to denote risk levels, creating a clear visual hierarchy.
How to Use It
This layout serves as a data risk heatmap, ideal for visualizing risk levels associated with different data elements. It fits well in a presentation sequence following a problem analysis slide, helping to summarize risk assessments. This format is useful in business scenarios such as data governance discussions, risk management meetings, or presentations on data quality. It allows stakeholders to quickly identify areas of concern and prioritize actions based on risk levels.
Text Placeholders & Capacity
Keep your copy within these limits so it fits without resizing. Node slots can accommodate brief text, roughly 8-10 words each.
| Placeholder | Count | Max characters (approx.) |
|---|---|---|
| Slide title | 1 | 30 |
| Subtitle | 1 | 50 |
| Item heading | 9 | 10 |
| Item body | 9 | 50 |
Slide Keywords
Download unlimited PowerPoint templates, charts and graphics for your presentations with our annual plan.
DOWNLOADReturn to Data Lineage PowerPoint Template.