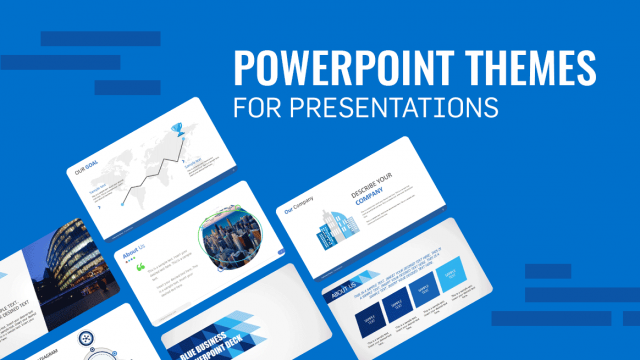
12 PowerPoint Themes 2024: Impactful Presentations That Stand Out
Collection of featured PowerPoint themes to make impactful presentations and engage your audience.
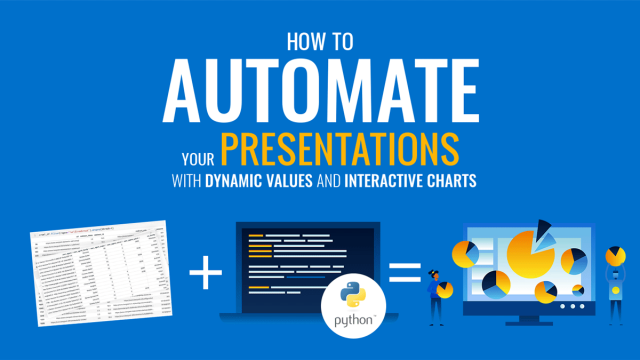
How to Automate your Presentations with Dynamic Values and Interactive Charts
One of the most important reasons we create presentations is to analyze data, get some insights, and share those findings. In some cases, when we analyze the same data numerous times, it helps a lot to automate the process.
How to Use Two Factor Theory to Improve Employee Engagement
Employee engagement has finally come to the forefront of the business world. A motivated, healthy and committed workforce is key to effectively scaling your business. Businesses with engaged employees enjoy lower rates of employee turnover. This leads to lower hiring costs and faster talent acquisition. A study conducted by the American Psychology Association revealed that […]

Market Research: Everything You Need to Know as a Business Leader
Today the markets are moving at a fast pace and in an unpredictable direction. Amidst such uncertainty, it’s extremely hard to determine the right course of action, especially when you are about to bring a new product or service to the market. So how can you reduce the risks of failure and predict potential ambiguities? […]
How To Use PowerPoint Icons to Boost your Presentation Visuals
In this post, we are going to show some tips for presenters willing to improve their presentation look and feel by adding PowerPoint Icons. The advice is valid for updating existing presentations or designing new presentations from scratch. We want to start with the distinction between what is considered a PowerPoint Icon and its difference from […]

Quick Tips to Kick-Out Boring Bullet Points
Using alternative bullet points delivers a powerful impact on your audience. Stamping out bullet points from the presentations is one of the most challenging task while preparing business presentations, as bullet points use high-value keyword phrases within bulleted content in a structured manner. Yet, at the same time using the basic, black font bullet points will […]

Quick Guide: Understanding the Pareto 80/20 Principle
Some observations by economists, sociologists and philosophers have been remarkable in shaping the way people view the world. One such observation was by an Italian economist named Vilfredo Pareto. His observation regarding the wealth inequality in Italy led to the Pareto principle. This principle is also known as the 80/20 rule and explains something quite […]
Vision & Mission Statement Template for PowerPoint Presentation
Define an organization’s vision and mission statements with the help of this guide on Vision and Mission PowerPoint Templates.

The 5 Main Phases of Project Management Life Cycle
Whether you are tasked to lead a small in-house project or take over a large, multi-people company-wide program, understanding how to plan and execute your project is integral for success. There’s a gap between making a decision and turning that decision into life, knowing what steps to perform, in what sequence and how different processes will drive (or stall) your project execution.