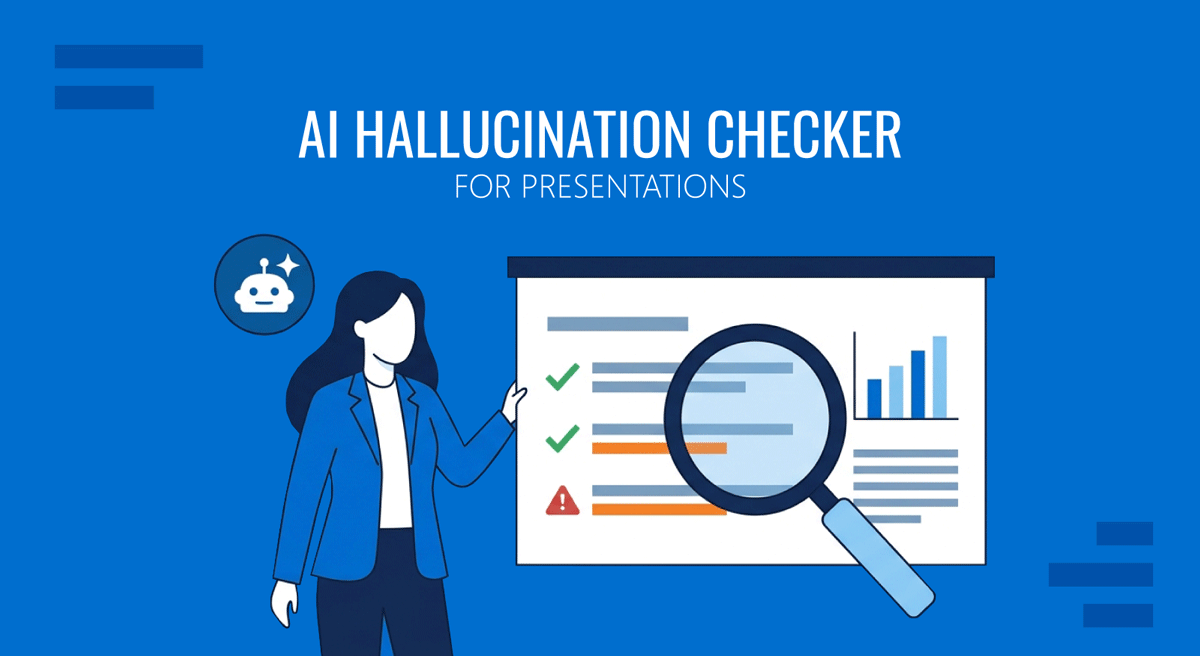
Generative AI has become a standard part of deck preparation. Presenters ask Claude for market sizing, prompt Copilot to summarize a quarterly report into talking points, or ask Gemini to pull comparable benchmarks for a competitive slide. The output arrives formatted, confident, and ready to paste. That last quality is the problem. Language models produce fabricated statistics, invented studies, misattributed quotes, and citations to papers that were never written, and they produce them in the same authoritative register they use for accurate information. There is no visual signal separating a real figure from a manufactured one.
The consequences are no longer theoretical. Damien Charlotin’s public AI Hallucinations Database has cataloged over a thousand court proceedings worldwide in which filings contained AI-fabricated case citations, beginning with the widely reported Mata v. Avianca matter in 2023 and expanding steadily since. Research from Stanford’s RegLab and Institute for Human-Centered AI found that general-purpose language models hallucinated on legal queries at rates between 69% and 88%, and that purpose-built legal research tools still produced incorrect or unsupported responses in roughly one out of six queries. Lawyers are not uniquely careless. They are simply the professional group whose errors get written into public record.
Presenters face the same exposure with less oversight. A fabricated market growth figure on a board slide does not trigger a judicial sanction, but it does invite a question you cannot answer, and the credibility damage lands in front of the people whose confidence you were trying to earn. This article sets out a practical verification framework for anyone using AI assistance in AI-generated presentation workflows, built around the moment where it matters most: before the deck leaves your hands.
Why AI Hallucinations Survive the Journey to a Slide
Understanding why models fabricate helps you predict when they will. A language model generates text by selecting probable continuations, not by retrieving verified records. When a topic appears rarely in training data, the model has no reliable basis for an accurate answer, but its architecture offers no mechanism for abstaining. It must produce a next token, so it produces the most plausible-sounding one. OpenAI’s 2025 research paper on why language models hallucinate argued that standard training and evaluation practices compound this, because benchmarks reward confident answers and penalize expressions of uncertainty. A model that says “I do not know” scores worse than one that guesses well.
Presentations then strip away the remaining safeguards. Slide content is compressed by design. A claim that arrived from the model wrapped in qualifying language (“estimates suggest,” “some reports indicate”) gets reduced to a clean figure in 28-point type because that is what fits and what reads well. The hedge disappears; the number stays. Visual design compounds the effect, since a fabricated statistic inside a well-formatted chart inherits the chart’s visual authority.
There is also a workflow problem. Slide deck preparation usually happens under time pressure, often the night before, and the verification step competes directly with design work, rehearsal, and stakeholder review. When something has to be cut, verification is invisible and therefore first to go. Sound data presentation practices assume the underlying numbers are real. No amount of chart design corrects a figure that does not exist.
The Four Failure Modes of AI-Generated Presentation Content
Not all AI errors look alike, and treating them as a single category makes them harder to catch. Four distinct patterns account for most of what makes it to slides.
Fabricated statistics
The model produces a specific number with a specific attribution: “According to Gartner, 67% of enterprises will adopt this by 2027.” The formatting is correct, the analyst firm is real, and the figure was invented. These are the most dangerous because specificity reads as evidence. A round number invites scrutiny; 67% sounds measured.
Phantom citations
The model names a study, a journal, an author, and sometimes a DOI, none of which correspond to an existing publication. Alternatively, it names a real paper but attributes findings to it that the paper does not contain. The second variant is worse, because a quick search confirms the paper exists and the presenter stops checking there. This practice can be lethal to the credibility of academic presentations.
Misattributed quotes
Executives, researchers, and historical figures get credited with statements they never made. Quotes are especially prone to this because paraphrases circulate widely online, and the model reproduces the circulating version rather than the original wording.
Confident extrapolation
The model takes a real data point and extends it beyond what the source supports, converting a regional finding into a global one, a single-year figure into a trend, or a correlation into a causal claim. Nothing here is invented outright, which makes it the hardest failure to detect and the easiest to defend badly under questioning.
The SOURCE Method: A Verification Framework for Presenters
Verification fails when it is approached as an undifferentiated chore. The SOURCE method breaks it into six discrete actions, each of which takes seconds once it becomes habit.
S: Separate claims from language. Read the AI output and mark every sentence containing a number, a proper noun, a date, or an attribution. Everything unmarked is framing and carries no factual risk. This step alone typically reduces the verification surface by half, because most AI-generated prose is connective tissue around a handful of assertions.
O: Originate the source. For each marked claim, locate the primary document. Not a blog post citing the study, and not the model’s description of the study. The actual report, filing, dataset, or press release. If you cannot reach a primary source in a reasonable search, the claim does not go on the slide. This rule has no exceptions worth making, and it resolves phantom citations immediately.
U: Unpack the number. When you reach the primary source, check what the figure actually measures. Confirm the population, the unit, the methodology, and whether the value is a measurement or a projection. Models routinely blur the line between reported results and forecasts. A statistic that was a vendor’s internal survey of 200 customers should not appear on your slide as an industry benchmark.
R: Re-date the claim. Establish when the data was collected, which is often years before the study was published. Then ask whether anything material has changed since. Market figures, headcounts, regulatory positions, and pricing decay quickly. A 2021 adoption statistic presented in 2026 without a date label is misleading even when the underlying number is accurate.
C: Cross-check independently. Confirm the claim through a second source that does not derive from the first, and do this without AI assistance. Asking a second model to verify the first model’s output produces agreement far more often than accuracy, since both draw on overlapping training data and both are optimized to be agreeable. Manual search, an industry database, or an internal analytics system are the appropriate tools here.
E: Enter it with attribution. Put the source on the slide itself, as a footnote with organization, publication title, and year. This is not decoration. Visible attribution forces you to complete the previous five steps, because a claim you cannot cite cannot be labeled, and the empty footnote is what catches you.
Building the Verification Pass Into Your Presentation Workflow
A framework only works when it has a fixed place in the process. Treat verification as a scheduled stage between content assembly and visual design, never as a final skim before sending.
Start by tiering your claims. Tier one covers load-bearing claims: any figure that supports a recommendation, a budget request, or a strategic conclusion. If the claim is wrong, the argument collapses. These get full SOURCE treatment without negotiation. Tier two covers supporting context, such as background market figures that shape the framing but don’t drive the decision. These get source verification and date checking. Tier three covers illustrative or directional statements, which should be rewritten as qualitative observations rather than defended as data.
Maintain a verification log alongside the slide deck, a simple sheet with the claim, the slide number, the primary source URL, the access date, and the initials of whoever confirmed it. This takes minutes and produces two benefits. It gives you an instant answer when someone asks where a number came from weeks later, and it makes the verification status of every claim visible to anyone reviewing the deck. Teams that practice data-driven decision-making already maintain this discipline for internal dashboards. Presentation content deserves the same treatment, particularly when the audience is external.
For decks assembled with Copilot inside PowerPoint or similar embedded AI-powered assistants, the risk profile shifts. When the assistant summarizes a document you provided, the grounding is stronger, and hallucination rates drop substantially. When it answers from general knowledge, you are back to the open-ended generation case where fabrication is most common. Know which mode you are in, and treat any claim the assistant produced without a document you supplied as unverified by default.
Red Flags That Signal a Fabricated Claim
Certain patterns should trigger immediate scrutiny before you spend time verifying.
Suspiciously precise figures attached to vague sources are the clearest signal. “Studies show that 73.4% of managers report…” combines false precision with an unnamed origin, and the combination almost never survives checking. Similarly, statistics that map perfectly onto your argument deserve a second look, because models are trained to be helpful and will generate the number your prompt implied you wanted.
Watch for citations you cannot find in one search. Real published research surfaces quickly. If a paper title returns nothing on the publisher’s site or a scholarly index, the reasonable conclusion is that it does not exist, not that your search was inadequate. The same applies to business reports attributed to major consultancies, which publish their work publicly and make it easy to locate.
Round-number consensus is another marker. When multiple claims in a single AI response all land on clean figures like 30%, 50%, and 2x, you are likely looking at estimates the model produced rather than measurements it recalled. Finally, watch for any quote that sounds too neatly aligned with your slide’s message. The pattern of presenting facts accurately requires distinguishing between a source that supports your case and a source that was written to support your case.
FAQs
Can I ask the AI model to check its own work for hallucinations?
Self-verification is unreliable. When asked to review its own output, a model frequently reproduces the same fabrication with added confidence, because the original text is now part of its context and it is optimized toward consistency and agreeableness. Self-checking catches formatting problems and internal contradictions, not invented facts. Verification requires an external reference the model cannot generate.
Does using a model with web search enabled solve the problem?
It reduces the problem considerably but does not remove it. Retrieval-grounded responses hallucinate at substantially lower rates than open-ended generation, since the model is summarizing retrieved text rather than reconstructing facts from training data. Errors still occur when the model misreads a retrieved page, cites a low-quality source as authoritative, or blends retrieved content with recalled content. Always open the linked source rather than trusting its summary.
How much extra time should I budget for verification?
Plan for roughly 15 to 20 minutes per ten AI-assisted claims once the process is familiar, concentrated on tier one items. The first few decks take longer. The time drops sharply after you develop the habit of marking claims as you generate them, rather than reconstructing what needs checking at the end.
What if the primary source sits behind a paywall?
Look for the publisher’s abstract, press release, or executive summary, which usually include the headline figures and a description of the methodology. If you can confirm the figure and its context from those, cite the paywalled work normally. If you cannot confirm it, treat the claim as unverified and either remove it or rephrase it as directional rather than quantitative.
Are some AI tools meaningfully safer than others for presentation research?
Measured hallucination rates vary across models and vary far more across task types. Grounded summarization of a document you supply produces error rates in the low single digits for current frontier models, while open-ended factual generation produces error rates an order of magnitude higher. The task you assign matters more than the tool you select, so prefer workflows where you supply the source material.
Should I disclose to my audience that AI helped build the deck?
Disclosure norms depend on context. In the United States, dozens of courts have issued standing orders requiring attorneys to disclose or certify AI use in filings (see the Law360 federal AI order tracker). Separately, the EU AI Act treats AI used in the administration of justice as high-risk and imposes content-marking and transparency duties under Article 50, in force from 2 August 2026. These are two distinct regimes, not one driven by the other. For internal business presentations, disclosure is rarely expected. The more useful standard is that your citations should be verifiable regardless of how the content was produced, which makes the disclosure question largely secondary.
How do I handle a fabricated figure discovered after the presentation?
Correct it directly and promptly. Send a brief written note to attendees identifying the specific claim, providing the corrected figure with its source, and stating whether the correction changes your recommendation. Prompt correction preserves credibility. Silence, followed by someone else finding the error, does not.
Does this apply to AI-generated charts and visuals as well?
Yes, and chart generation adds a distinct risk. When a model produces a chart from a described dataset rather than an uploaded file, it may interpolate missing values to make the visualization coherent. Always generate charts from data you supply directly, and check that axis labels, units, and totals match your source file.
Final Words
The verification burden created by generative AI is real, but it is also bounded. Most decks contain fewer than a dozen claims that genuinely carry weight, and the SOURCE method applied to those claims takes less time than the design work already accepted as necessary. What changes is the assumption behind the process. Content that arrives formatted and confident no longer earns the benefit of the doubt.
Presenters who build verification into their preparation gain something beyond error avoidance. They walk into the room knowing every number on the screen can be traced to a document, which changes how they answer hard questions and how the audience reads their authority. That confidence is difficult to manufacture and impossible to fake, and it is the actual return on twenty minutes of checking.