Business Intelligence PowerPoint Designs
Find powerpoint templates and designs focused on showing data insights through the use of visual representations. You can download the templates, complete the data from your Excel table and update the charts. The final results will be customizable to your needs. Professional PowerPoint Presentations targeted for executive audiences.

Simple Business Card PowerPoint Template
Business PowerPoint Templates
Ultimate Professional PowerPoint Template
Template Backgrounds

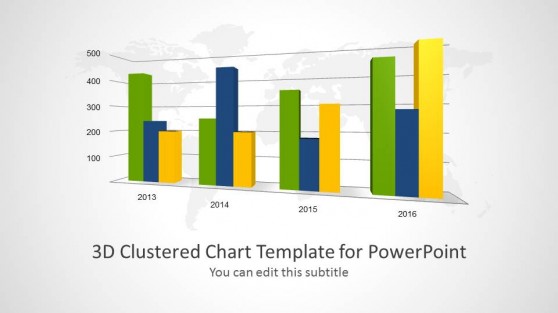
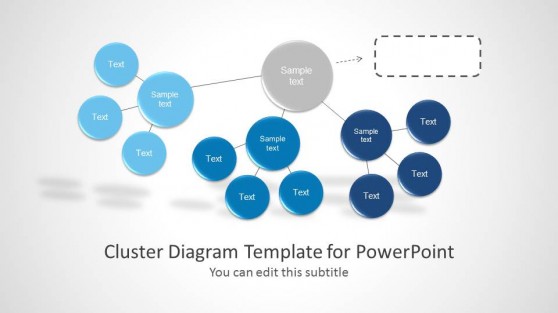
3D Clustered Chart Template for PowerPoint
Data & Charts