Slide 3 of 9 from World Map Template with Pie Charts for PowerPoint
6051-01-world-map-with-pie-diagram-3
World Map with Pie Chart for Asia
- Map
- Country Map
- Context Slide
- 16:9
- 100% Editable
The World Map with Pie Chart for Asia slide from the World Map Template with Pie Charts for PowerPoint combines geographic and statistical data visualization, making it suitable for business presentations focused on market analysis and demographic studies. This slide layout integrates editable shapes and vector icons to highlight regional performance effectively within a corporate presentation or pitch deck template.
What’s on This Slide
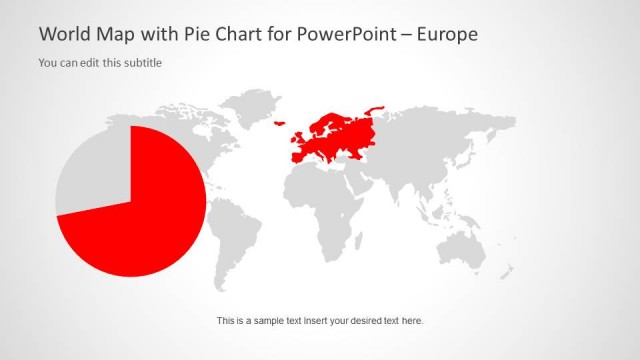
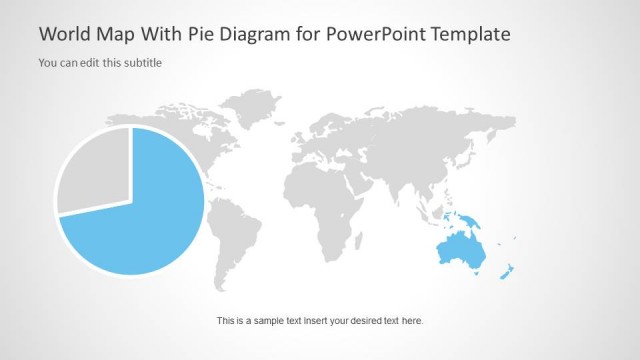
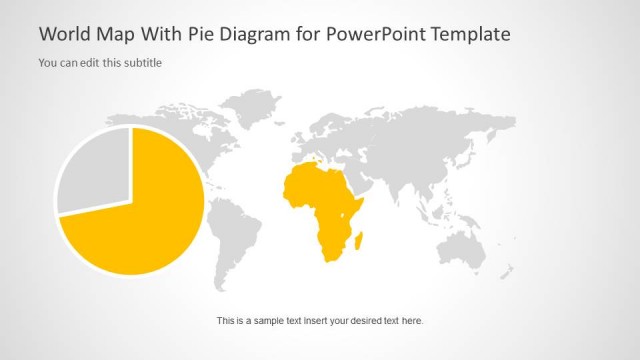
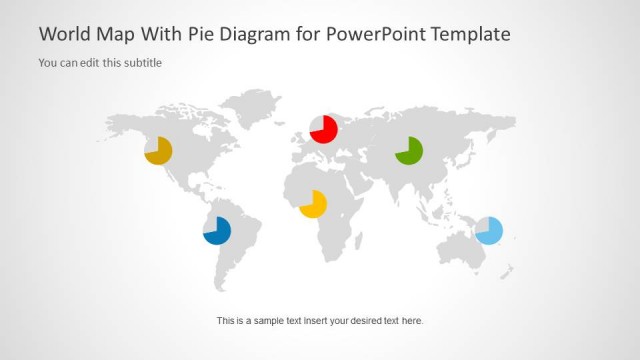
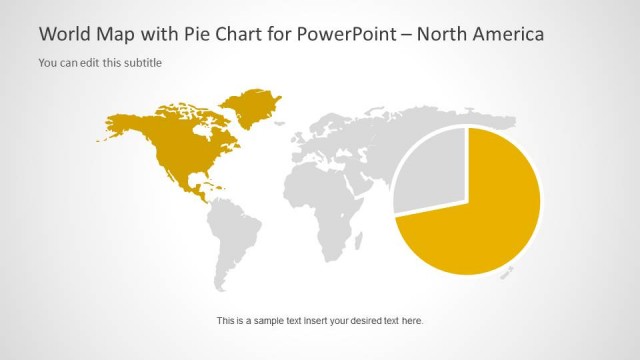
The layout features a world map with a highlighted region representing Asia, colored in green. A pie chart is positioned to the left of the map, displaying a green segment. The pie chart is semi-circular, with a visible division indicating data representation. The title is centered at the top, while a subtitle placeholder is directly beneath it. A text placeholder is located at the bottom, indicating where additional information can be added. The overall composition balances the map and chart, creating a clear visual hierarchy.
How to Use It
This layout serves as a geographical representation combined with data visualization, ideal for showcasing statistics related to Asia. It fits well in a presentation sequence following an introduction or overview slide. Real-world scenarios include market analysis, demographic studies, or regional performance reviews. The combination of a map and pie chart allows for effective communication of data trends and insights specific to the Asian region.
Text Placeholders & Capacity
Keep your copy within these limits so it fits without resizing. Body slots can hold around 15-20 words each.
| Placeholder | Count | Max characters (approx.) |
|---|---|---|
| Slide title | 1 | 40 |
| Subtitle | 1 | 40 |
| Body paragraph | 1 | 100 |
Slide Keywords
Download unlimited PowerPoint templates, charts and graphics for your presentations with our annual plan.
DOWNLOADReturn to World Map Template with Pie Charts for PowerPoint.