Slide 2 of 2 from Wardley Map PowerPoint Template
Customizable Wardley Map Presentation Template
Wardley Map Diagram for Business Strategy
- Diagram
- Other
- Strategic Analysis Slide
- 16:9
- 100% Editable
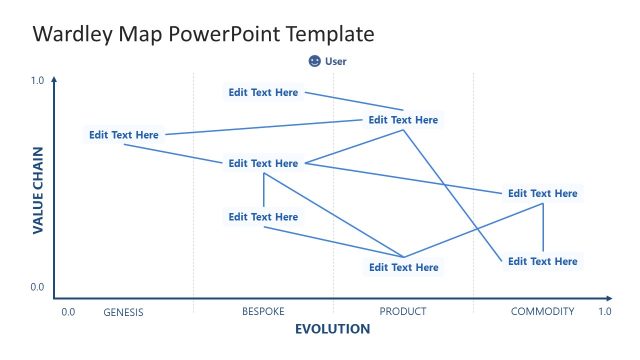
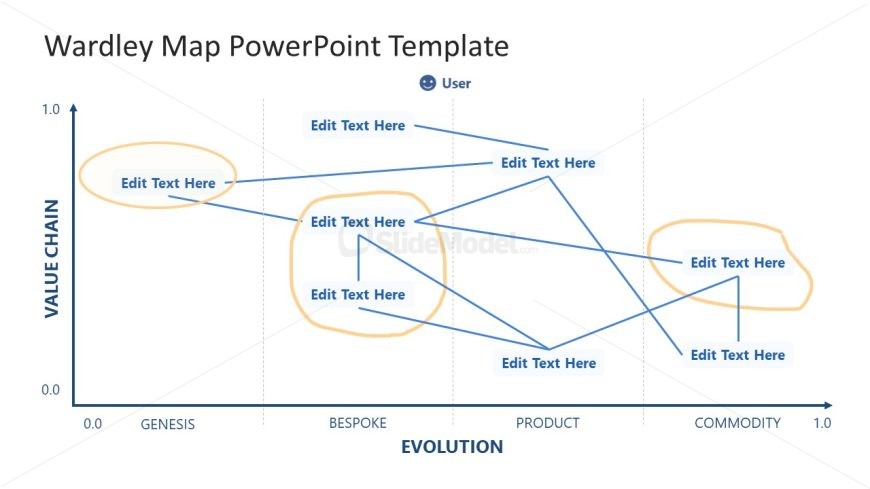
The Wardley Map Diagram slide from the Wardley Map PowerPoint Template offers a clear strategic analysis tool for business presentations. It visualizes value chain components and their evolution stages, making it ideal for product development and market analysis. This slide layout supports corporate presentations by illustrating dependencies with editable shapes and vector icons, enhancing clarity in strategic planning discussions within slide decks.
What’s on This Slide
The slide features a Wardley map with two axes labeled 'Value Chain' and 'Evolution.' The vertical axis ranges from 0.0 to 1.0, while the horizontal axis spans from 'Genesis' to 'Commodity.' Several circular nodes are present, each containing a text placeholder, positioned at various points along the map. Connecting lines illustrate dependencies between these nodes, creating a network-like structure. The background is predominantly white, with blue lines and text. The overall layout is clear, emphasizing the relationships between components.
How to Use It
This layout serves as a strategic mapping tool, ideal for visualizing business components across different stages of evolution. It fits well in presentations focused on brand strategy or management discussions. The diagram can be used to illustrate dependencies and relationships among various business elements, making it suitable for strategic planning sessions. It is particularly effective for teams analyzing product development or market positioning, helping to clarify complex concepts visually.
Text Placeholders & Capacity
Keep your copy within these limits so it fits without resizing. Node text slots can accommodate about 20 characters each.
| Placeholder | Count | Max characters (approx.) |
|---|---|---|
| Item body | 6 | 20 |
Slide Keywords
Download unlimited PowerPoint templates, charts and graphics for your presentations with our annual plan.
DOWNLOADReturn to Wardley Map PowerPoint Template.