Value Stream Map PowerPoint Diagrams
![Create Professional Value Stream Map Diagrams for your presentation with this 100% editable library. Each element can be dragged and dropped in your slides. You can customize the colors, size, effect of the elements to adapt to your desired theme. Colors are designed using the PowerPoint Palette feature, allowing the user to change the theme […]](https://slidemodel.com/wp-content/uploads/6889-01-value-stream-map-powerpoint-diagram-cover-870x490.jpg)
Create Professional Value Stream Map Diagrams for your presentation with this 100% editable library. Each element can be dragged and dropped in your slides. You can customize the colors, size, effect of the elements to adapt to your desired theme. Colors are designed using the PowerPoint Palette feature, allowing the user to change the theme and the template shapes will adapt automatically.
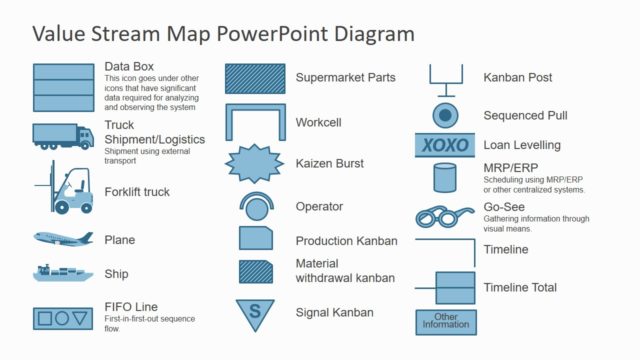
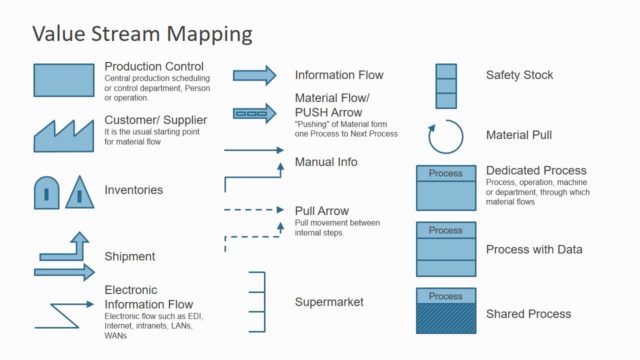
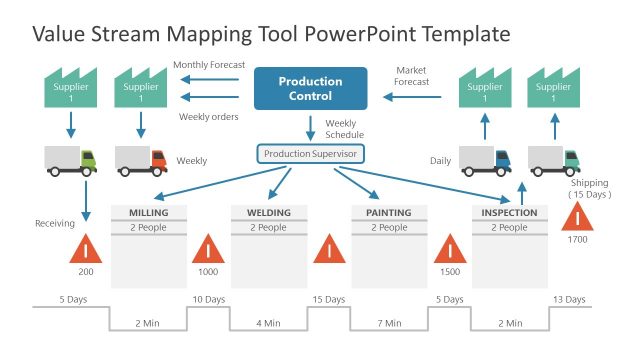
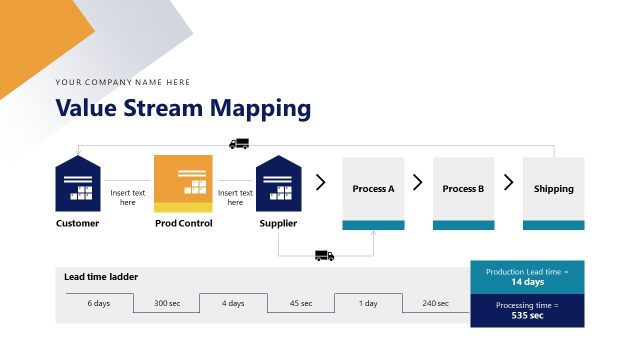
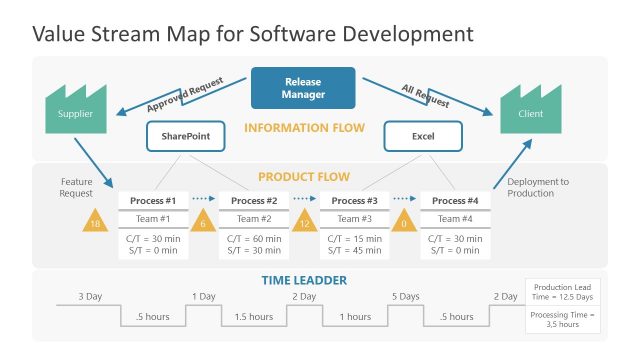
Value stream mapping (also known as VMS) is a lean manufacturing practice to evaluate , manage and design the flow of raw materials , manufactured items and information required to deliver a product to a customer. This template provides the standard symbols used to depict work steams and information flows. Items map which step adds (or not) value to the customer, from the its standpoint.
Return to Value Stream Map PowerPoint Diagram.