NPS PowerPoint Templates
Customer experience teams reporting quarterly NPS results need a way to show score movement alongside the comments driving it, not just a single number on a slide. An NPS PowerPoint template provides that context with a structured layout, pairing the score trend with promoter, passive, and detractor segments in a single view. Our NPS templates are built for customer experience managers and product teams who track Net Promoter Score as a recurring metric.
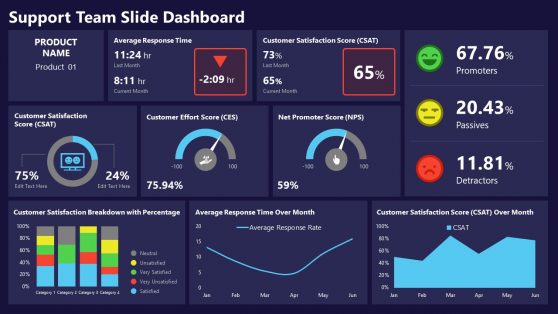
Support Team PowerPoint Dashboard
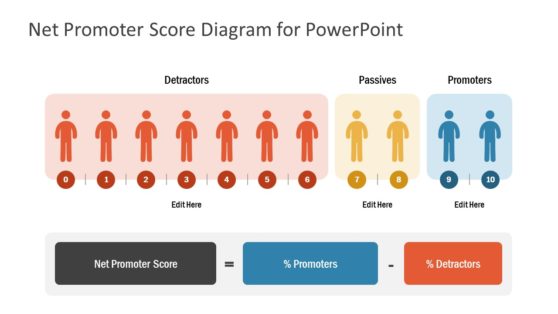
Net Promoter Score Diagram for PowerPoint
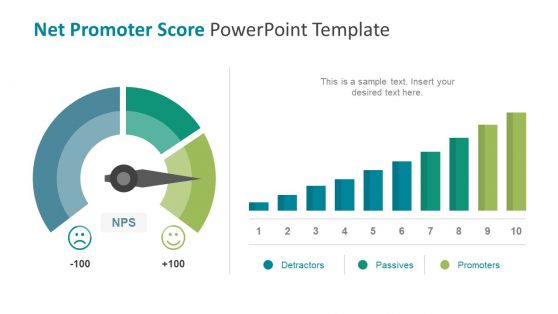
Net Promoter Score PowerPoint Template
What Belongs in an NPS PowerPoint Template
An NPS PPT template is a slide set built around the mechanics of Net Promoter Score reporting: score trend over time, respondent segmentation, and the follow-up actions tied to detractor feedback. A standard version covers:
- Score trend slides comparing NPS across quarters or product lines
- Promoter, passive, and detractor breakdown layouts
- Verbatim comment slides organized by theme
- Action plan slides tied to detractor feedback
How Teams Use NPS Templates Day to Day
Customer experience managers use these slides to walk product leadership through score movement after each survey wave, while product managers reference the detractor breakdown when prioritizing a roadmap item tied to recurring complaints. Teams that also track broader account health often place the NPS trend alongside a customer journey map to show where the score shifts along the customer lifecycle. Since customer success teams are frequently split between regional offices, presenting from Google Slides lets a local team adjust the segmentation before a regional review without exporting a separate file.
What is an NPS presentation template?
It’s a slide deck built to present Net Promoter Score results, including the trend over time and the breakdown between promoters, passives, and detractors, alongside any follow-up actions.
How do I create an NPS PowerPoint template?
Start from a layout with the score trend and segmentation sections already structured, then plug in your survey export and update the comment themes for the current period.
Where can I find a free NPS presentation template?
Our collection includes free and premium NPS layouts, from a single score-trend slide to a full deck covering segmentation, verbatim comments, and detractor action plans.