Heat Map PowerPoint Templates
The Heat Map PowerPoint Templates are visually appealing, well-crafted design layouts. It is a versatile analytic template you can use in financial, business, data, geographical visualization, etc. The template is made up of colors, shapes, and icons.
With these color-themed presentation templates, you can visually represent your data and analyze them to see areas that need improvement. Using any of these templates makes data visualization more accessible and better. Please go through our array of Heat Map Templates to download a suitable template for your next data visualization and analysis.
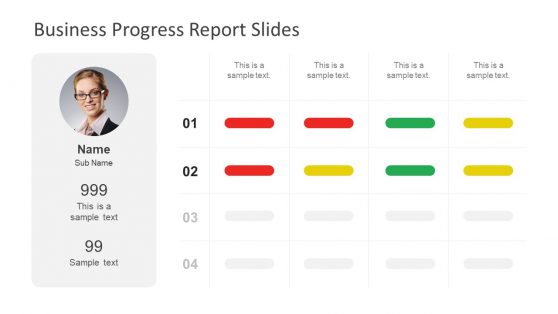
Business Progress Report Slides for PowerPoint
A heat map is a data visualization technique that visually depicts the state of the situation using color codes. These colors vary between hue and intensity. The Heat Map Template is used across various fields for accurate analysis and appealing and engaging visualization. It differs from the basic analytics reports by being color-themed, visually appealing, and easily comprehended. They are all designed to contain large data sets in a context that’s easy to comprehend. They also serve as a data analytics tool that helps identify, prioritize, and mitigate organizational or project risks.
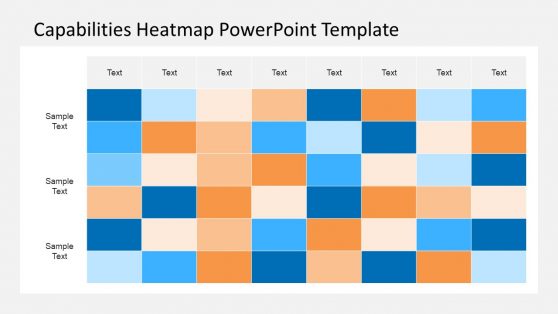
For instance, the Capabilities Heat Map PowerPoint Template offers an appealing view of essential business strategies and considerations to the management. It gives a visual representation of a company’s current functioning, performance, and need for improvements. Heat maps are a way to analyze a company’s existing data and update it to reflect the growth and other specific efforts. Please browse through our compilation of Heat Map PowerPoint Templates to select the one suitable for your next data visualization. The good news is that you can edit the placeholder text to suit your preferences and make the template personal.
Choose from our creatively designed Heat Map PPT Template to help you save time, energy, and resources in your next presentation. Using any of these templates makes your data visualization and analysis understandable for any audience. They are all Mac and Windows supported. You can use these PowerPoint templates on your Mac or Windows computer. They are also Keynotes, Office365, and Google Slides compatible.
How Heat Map Templates Will Help Your Business?
Undoubtedly, the Heat Map Templates are designed to help you ease stress and increase your productivity. Below are other benefits of using our Heat map template.
- It will help you visually describe your business sales, product use, or financial data.
- It helps analyze your business’s current performance and reveals areas that need improvement.
- It helps you analyze the customer’s demographics. It shows the risk of market saturation or areas that need a boost.
- Instead of using numbers and spreadsheets, you can use visual heat maps to display your organization’s data using color shading.
What Is A Heat Map In The Presentation?
A heatmap is a visual illustration of data that uses a method of color-coding to represent different values. It is useful and helpful because you can easily represent bulky data by color coding. It implies you can also interpret and analyze your data at a glance to your audience.
Which professions can get the benefits of heat map presentations?
The heat Map template is a versatile data visualization tool used by data experts across various industries. Below are some of the professionals that use it and its application.
- Business Analysis: Heat maps are used in business analytics to visually represent a company’s current functioning, performance, and the need for improvements.
- Sports: Heat maps can be used in many sports and influence coaches’ decisions based on high and low densities of data athletes display. It is used to analyze one’s opponent’s strategies, which will help in making informed decisions.
- Geographical Visualization: Heat maps visualize and display a geographic data distribution. It represents different densities of data points on a geographical map to help users see the intensities of certain phenomena and show the most or least important items.
- Financial Analysis: Heat maps can remove the tedious process and enable the user to visualize data points and compare amongst the different performers. It allows drawing predictions from patterns while evaluating past numerical data.
Can you do a heat map in PowerPoint?
Yes, you can always change to a heat map. It means you can use colors (hue or intense) to represent your data, making it easy for people to take in lots of data at a glance. All you need to do is click on the Home icon, then select the layer pane. Then, on the Field List tab, left-click on the Heat Map.