Slide 5 of 5 from Tablet Chart Concept for PowerPoint with Yellow Style
6035-01-tablet-chart-concept-yellow-wide-5
Line Chart Design for Presentations
- Chart
- Line Chart
- Evaluation Slide
- 16:9
- 100% Editable
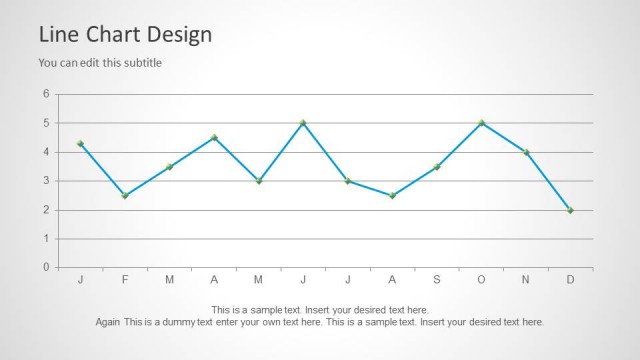
The Line Chart Design slide from the Tablet Chart Concept for PowerPoint with Yellow Style template offers a clear visual tool for trend analysis and financial reporting. This slide layout includes editable shapes and vector icons to enhance business presentations, making it suitable for illustrating sales performance and other time-based data within a corporate presentation or pitch deck template.
What’s on This Slide
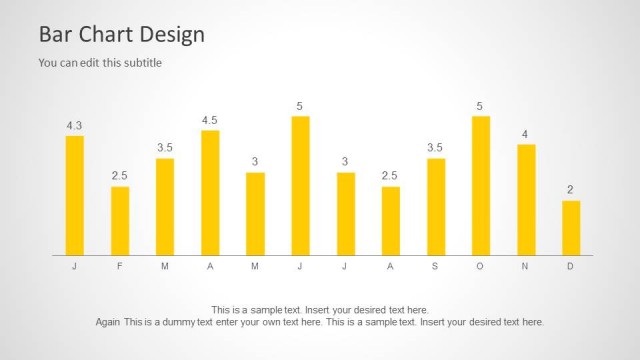
The slide features a line chart positioned centrally, displaying a series of data points connected by a yellow line. The horizontal axis is labeled with months, while the vertical axis indicates values ranging from 0 to 6. Above the chart, there is a title placeholder aligned to the left and a subtitle placeholder directly beneath it. Below the chart, two text placeholders are present for additional commentary, centered and evenly spaced. The background is light gray, providing contrast for the chart and text elements.
How to Use It
This layout serves as a line chart design, ideal for showcasing trends over time. It fits well in a presentation sequence following data analysis or performance reviews. Common scenarios include financial reports, sales trends, or any context requiring a visual representation of fluctuating data points. The structure allows for easy integration of data while maintaining clarity and focus on the chart's message.
Text Placeholders & Capacity
Keep your copy within these limits so it fits without resizing. Body slots can accommodate roughly 15-20 words each.
| Placeholder | Count | Max characters (approx.) |
|---|---|---|
| Slide title | 1 | 30 |
| Subtitle | 1 | 50 |
| Body paragraph | 2 | 100 |
| Chart title | 1 | 30 |
| Axis label | 2 | 20 |
Slide Keywords
Download unlimited PowerPoint templates, charts and graphics for your presentations with our annual plan.
DOWNLOADReturn to Tablet Chart Concept for PowerPoint with Yellow Style.