Slide 1 of 5 from Tablet Chart Concept for PowerPoint with Yellow Style
Data Chart Template Design for PowerPoint
Tablet Chart Concept for PowerPoint Overview
- Chart
- Bar Vertical
- Evaluation Slide
- 16:9
- 100% Editable
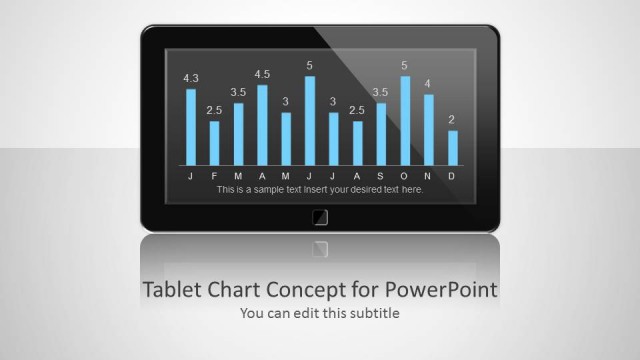
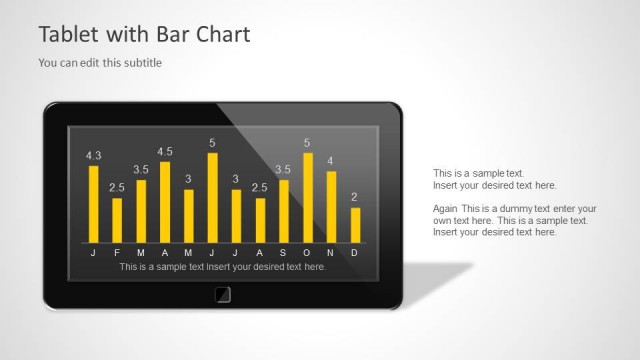
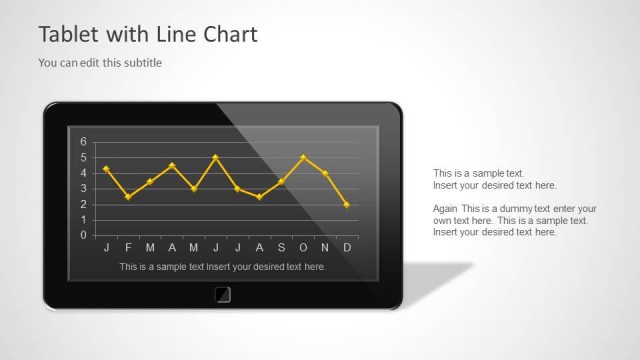
The Tablet Chart with Bar Graph slide from the Tablet Chart Concept for PowerPoint with Yellow Style template offers a clear visualization of monthly data trends using editable slides. Ideal for business presentations, this slide integrates a tablet device frame with vertical bar charts, supporting effective sales and marketing analysis within a professional slide deck.
About This Slide
Tablet clipart design for PowerPoint presentations with data dashboard chart.
What’s on This Slide
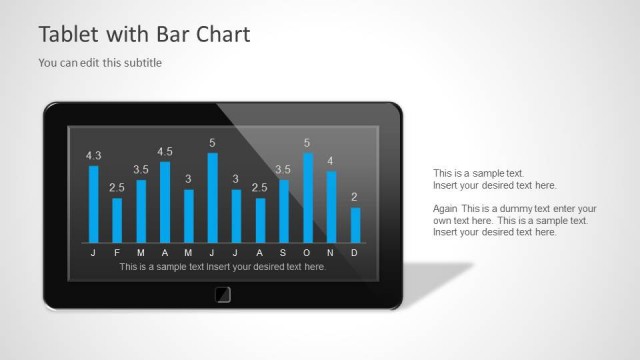
The slide features a tablet device displaying a bar chart. The chart is centered within the tablet screen, showcasing vertical yellow bars representing data values for each month from January to December. The background is a light gradient, enhancing the visual contrast. Below the chart, there are text placeholders for a subtitle and body text, aligned centrally. The overall layout emphasizes the chart while maintaining a clean and organized appearance, with the tablet device framed prominently.
How to Use It
This layout serves as a data visualization tool, effectively presenting bar chart information in a tablet format. It fits well in presentations that require a clear display of monthly data comparisons. This design is suitable for business reports, performance reviews, or marketing analysis, where visual data representation is crucial. It can be used to illustrate trends over time or to highlight key performance indicators in a concise manner.
Text Placeholders & Capacity
Keep your copy within these limits so it fits without resizing. Node labels can accommodate brief text, roughly 5 characters each.
| Placeholder | Count | Max characters (approx.) |
|---|---|---|
| Slide title | 1 | 40 |
| Subtitle | 1 | 50 |
| Item heading | 12 | 5 |
| Item body | 12 | 5 |
Slide Keywords
Download unlimited PowerPoint templates, charts and graphics for your presentations with our annual plan.
DOWNLOADReturn to Tablet Chart Concept for PowerPoint with Yellow Style.