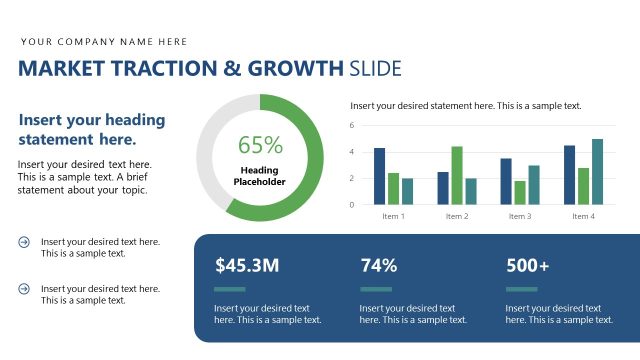
Slide 8 of 15 from Startup Fundraising Pitch Deck PowerPoint Template
Traction Slide with Statistics & Graphs
Traction Metrics Overview for Startup Pitch Deck
- Chart
- Bar Vertical
- Evaluation Slide
- 16:9
- 100% Editable
The Traction Metrics Overview slide from the Startup Fundraising Pitch Deck PowerPoint Template provides a clear layout to display user growth and revenue performance indicators. This slide uses editable shapes and bar charts to help startups communicate key metrics effectively within a business presentation or pitch deck. It is designed to integrate seamlessly with other slide templates for investor-focused presentations.
What’s on This Slide
The layout features two bar charts on the left side, each with two bars representing different items. The charts are aligned vertically, with the first chart above the second. Each chart has a title placeholder above it, aligned left. On the right side, there are two rectangular boxes stacked vertically, displaying numerical values and headings. The first box shows a percentage, while the second box contains two numerical values. Text placeholders are present below each chart and box, aligned left. The overall color scheme includes a dark background with light-colored elements.
How to Use It
This layout serves to present traction metrics, such as user growth or revenue figures, effectively. It fits within a pitch deck, typically following problem and solution slides, to showcase progress. This structure is useful for startups to highlight key performance indicators and achievements, making it suitable for investor presentations. It can also be adapted for internal reports to track business performance over time.
Text Placeholders & Capacity
Keep your copy within these limits so it fits without resizing. Body slots can hold roughly 15-20 words each.
| Placeholder | Count | Max characters (approx.) |
|---|---|---|
| Chart title | 2 | 20 |
| Item heading | 4 | 15 |
| Item body | 4 | 50 |
| Body paragraph | 4 | 80 |
Slide Keywords
Download unlimited PowerPoint templates, charts and graphics for your presentations with our annual plan.
DOWNLOADReturn to Startup Fundraising Pitch Deck PowerPoint Template.