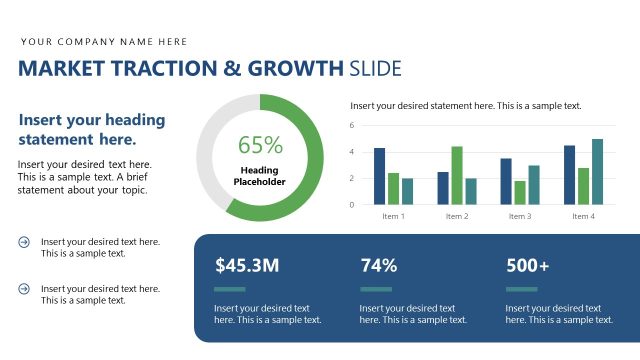
Slide 10 of 12 from Modern Pitch Deck PowerPoint Template
Traction Slide with Line Graph and Notes Segment
Traction and Growth Metrics Slide
- Chart
- Line Chart
- Evaluation Slide
- 16:9
- 100% Editable
What’s on This Slide
The slide features a line chart positioned centrally, displaying two growth metrics over four quarters. The chart has a light gray background with a white border. The left side contains a vertical axis labeled with values ranging from 0 to 250, while the bottom axis shows quarterly labels from Q1 to Q4. Two lines in varying shades of green represent different metrics, with data points highlighted in green. To the right, there are two text placeholders stacked vertically, one for a percentage and another for a monetary value, both aligned to the right. The title is prominently displayed at the top in bold text.
How to Use It
This layout serves to present key performance indicators visually, making it suitable for showcasing traction metrics in a business pitch. It fits well after problem and solution slides, providing evidence of growth and success. This structure is ideal for scenarios where businesses need to highlight progress, such as funding pitches or quarterly reviews. It can also be used to compare metrics over time, demonstrating trends and performance improvements effectively.
Text Placeholders & Capacity
Keep your copy within these limits so it fits without resizing. Text slots can hold around 15-20 words each.
| Placeholder | Count | Max characters (approx.) |
|---|---|---|
| Slide title | 1 | 30 |
| Item body | 2 | 100 |
Slide Keywords
Download unlimited PowerPoint templates, charts and graphics for your presentations with our annual plan.
DOWNLOADReturn to Modern Pitch Deck PowerPoint Template.