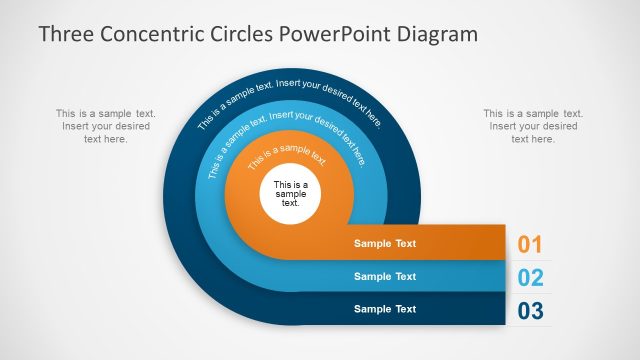
Solution Concentrated Process Infographic PowerPoint Template
Present your lab findings in the academic sessions with our Solution Concentrated Process Infographic PowerPoint Template. Researchers create different solution concentrations in biotechnology, microbiology, genetics, and chemistry for experimental purposes. They use combinations of solutes and solvents to make diluted or concentrated solutions and use them for varying purposes like chemical manufacturing. We have created this template with engaging diagrams to help science experts and researchers present their thoughts or research outcomes in educational sessions like webinars, seminars, or conferences. They can also use this template in their course material to explain solutions, drug design, and other pharmaceutical product development concepts. Users can also edit and print the designs to paste these diagrams into their thesis documents. Lab managers or technicians can paste the diagram on the walls of their labs to help researchers understand various concentrations.
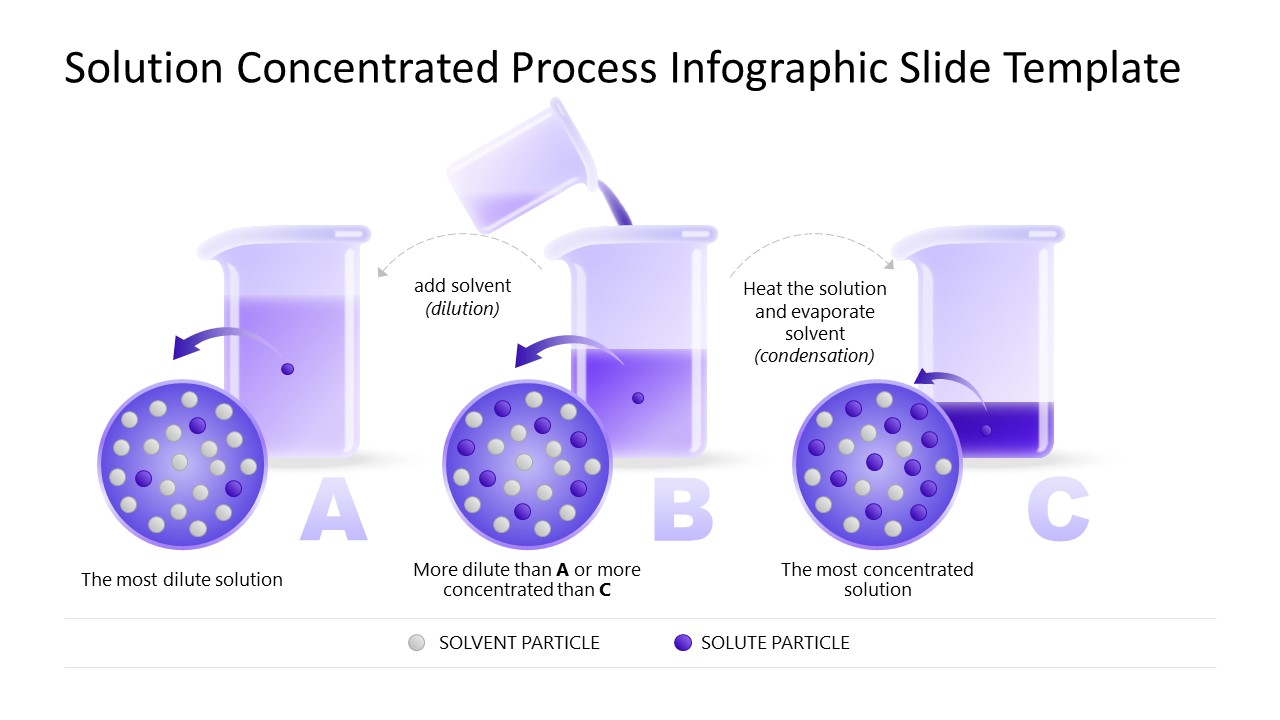
The Solution Concentrated Process Infographic PowerPoint Template has two slides with a purple color palette for solvents, solute particles, and solutions. The first slide shows three laboratory jars filled with solutions. It contains three sets of figures: A, B, and C. Each jar has a circular shape that contains many particles, indicating the number of solvent and solute particles. The characteristics of each jar solution are:
- A: The most dilute solution
- B: More dilute than A and less concentrated than C
- C: The most concentrated solution
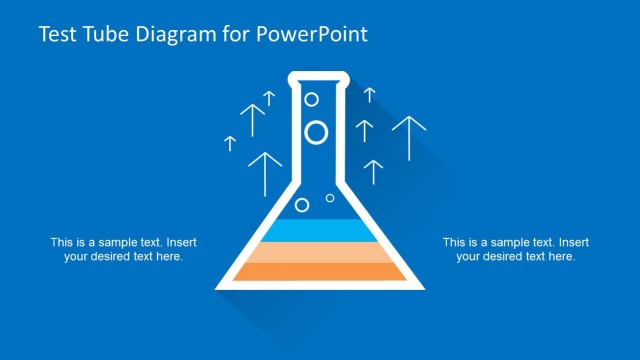
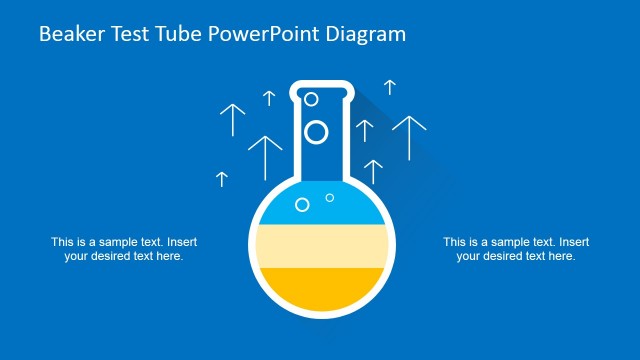
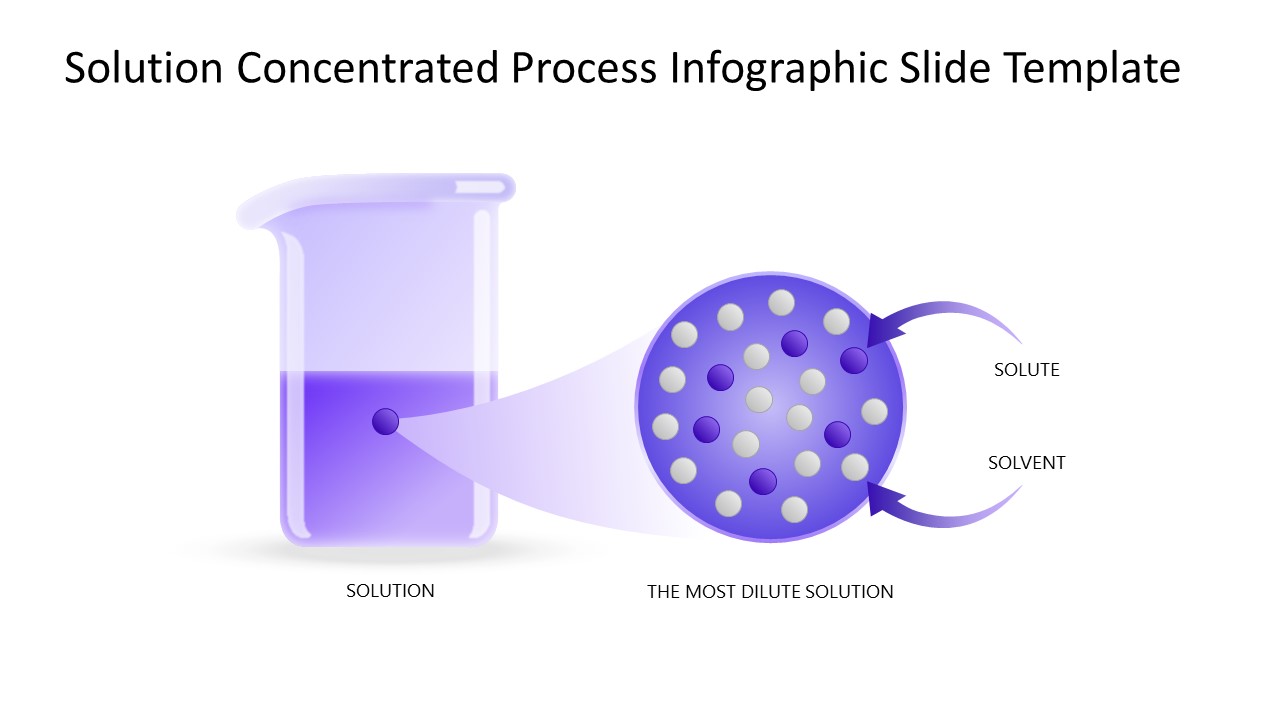
Below the diagram is a color label for solvent and solute particles. The second slide has a glass jar with a solution and a small circular shape depicting the amount of solvent and solute particles in the solution indicated arrows. You can change the number of jars and color labels or edit the text sections based on your preferences. Download our solution concentrated process infographic template for Google Slides and Keynote. Personalize it today!


You must be logged in to download this file.
DOWNLOAD- Category
- Diagrams
- Rating

 Loading...
- Size
- 16x9
- Item ID
- 22913-01
- Colors
Subscribe today and get immediate
access to download our PowerPoint templates.