Slide 14 of 20 from Small Business Company Profile Presentation PowerPoint Template
Our Global Sales Analytics Slide with Map Layout
Global Sales Analytics Presentation Slide
- Map
- World Map
- Strategic Analysis Slide
- 16:9
- 100% Editable
What’s on This Slide
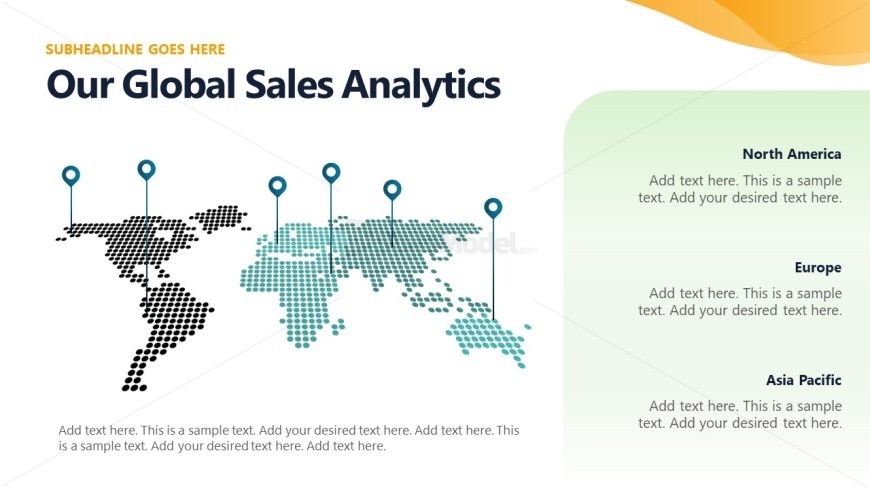
The slide features a world map composed of dotted patterns in two colors, with markers indicating specific regions. The map is positioned on the left side, while the right side contains three text placeholders for regional analytics. Each placeholder is aligned vertically, labeled for North America, Europe, and Asia Pacific. The title is prominently displayed at the top, with a subheadline placeholder above it. The overall layout is balanced, with a color gradient background transitioning from white to light green, enhancing visual separation between the map and text areas.
How to Use It
This layout serves as a geographic representation of sales analytics across different regions. It is suitable for presentations discussing global market performance or regional sales strategies. Positioned after introductory slides, it effectively summarizes key data points. This structure can be used in business contexts such as quarterly sales reviews, market expansion discussions, or strategic planning sessions, providing a clear visual overview of sales distribution.
Text Placeholders & Capacity
Keep your copy within these limits so it fits without resizing. Node body slots can accommodate detailed analytics, roughly 30-40 words each.
| Placeholder | Count | Max characters (approx.) |
|---|---|---|
| Slide title | 1 | 30 |
| Subtitle | 1 | 50 |
| Item heading | 3 | 30 |
| Item body | 3 | 150 |
Slide Keywords
Download unlimited PowerPoint templates, charts and graphics for your presentations with our annual plan.
DOWNLOADReturn to Small Business Company Profile Presentation PowerPoint Template.