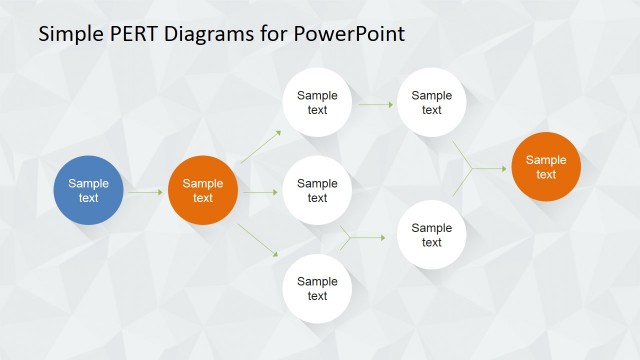
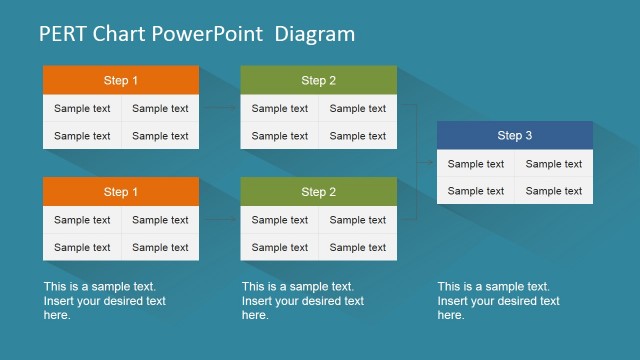
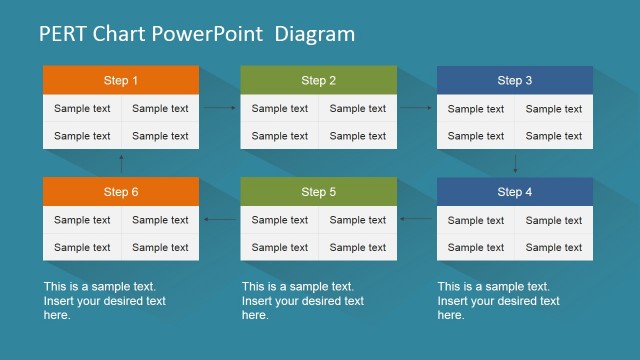
PERT Chart for PowerPoint – An Effortless Statistical Tool
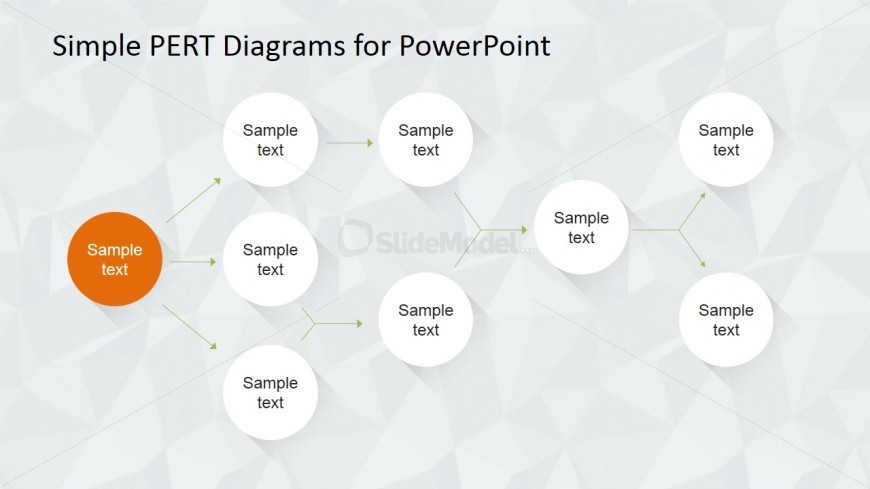
The slide is a simple representation of easy to download, easy to use and easy to edit Simple PERT Diagrams for PowerPoint template. This handy template has effects that are simple with connectors (arrows) and shapes (round) are PowerPoint objects. The slide has multi-color attribute created via PowerPoint’s fill colors tool. So, just spend time and effort on collecting important data with regard to your project and leave rest of the efforts on the template, which will save your time and effort and allows you to invest the time on other planning and messaging aspects of the presentation. This PERT chart works well for both finance and project management presentations along with the presentations on sales and marketing.
Return to Simple PERT Diagram for PowerPoint.