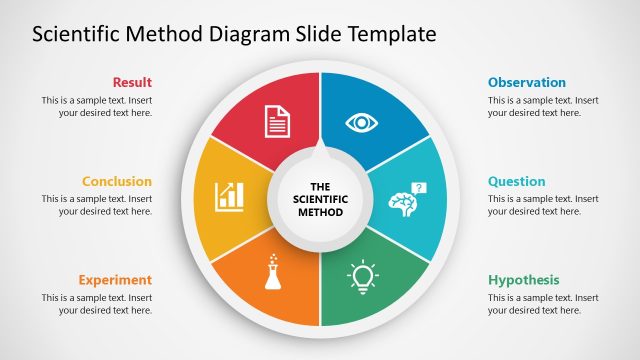
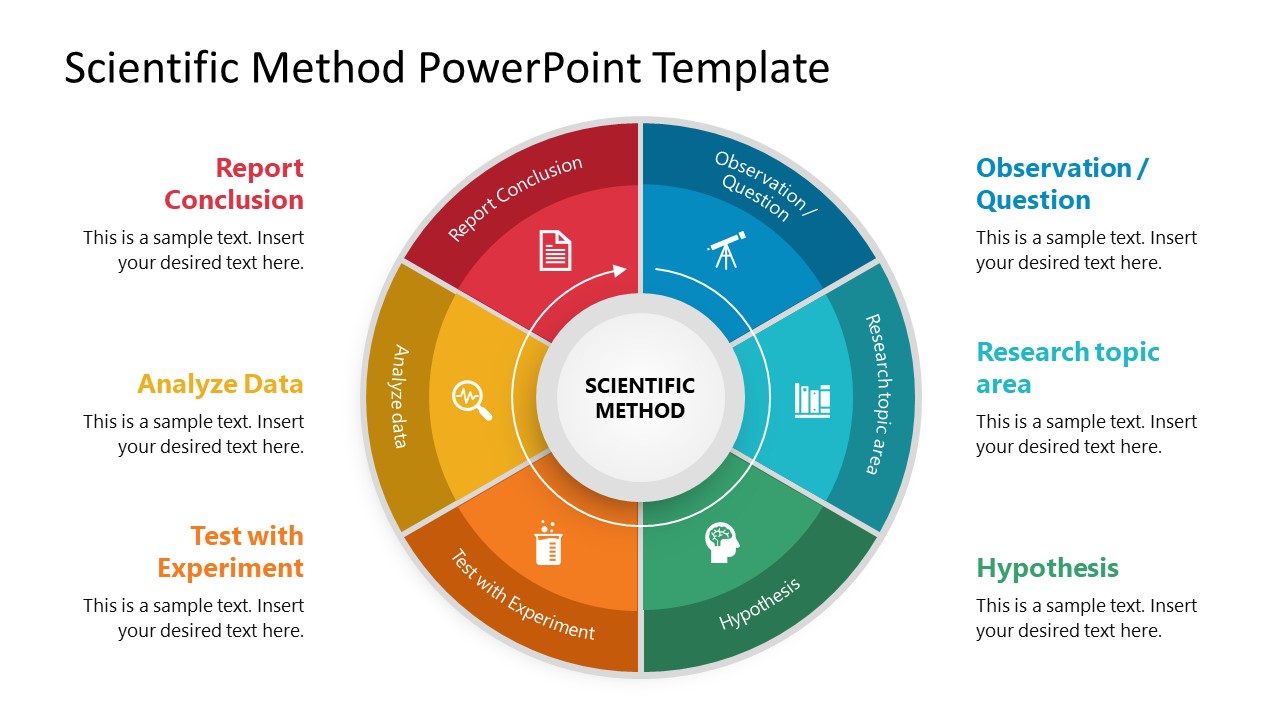
Scientific Method Diagram PowerPoint Template
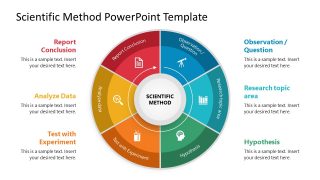
Present your research and experimentation outcomes using the Scientific Method Diagram PowerPoint Template. A scientific method is a problem-solving technique to resolve scientific issues and critical problems. We have created this scientific method diagram template for scholars, researchers, and students to create engaging PowerPoint presentations. It can be used to present the results of the testing procedures or for training purposes. The six phases of the scientific method that can be delivered using this template are:
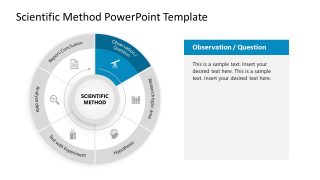
- Observations: In this step, quantitative and qualitative observations are made related to the particular issue or the subject for which the scientific method is employed.
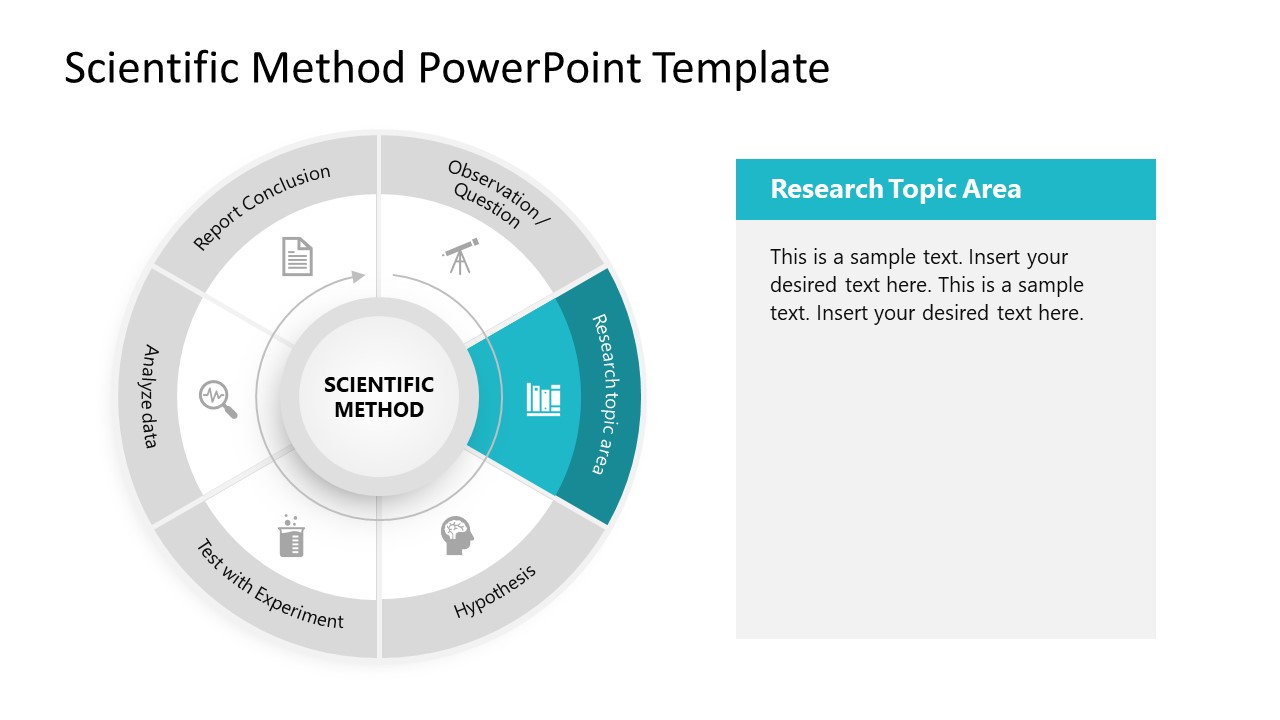
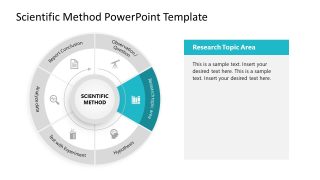
- Research Topic Areas: In this part of the scientific method, the
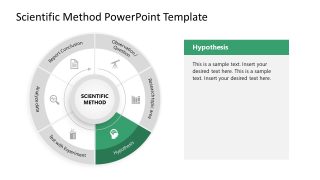
- Hypothesis: The hypothesis is the logical conclusion or tentative explanation of observations.
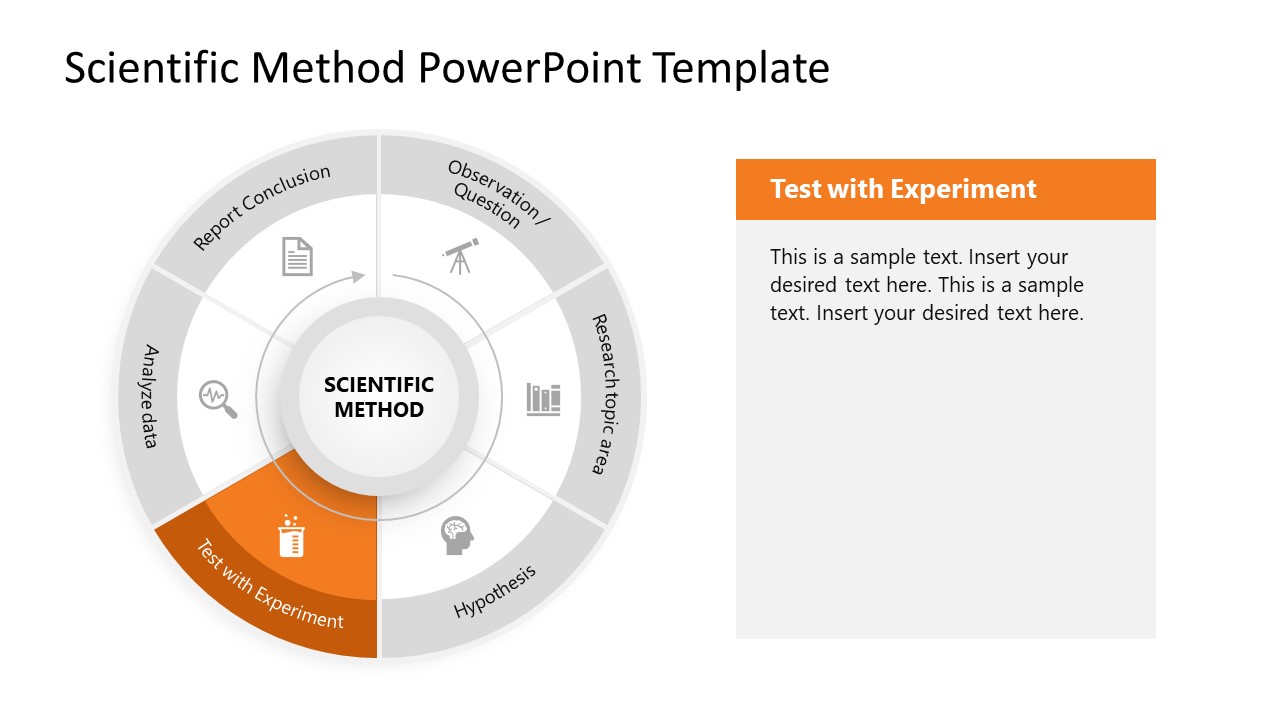
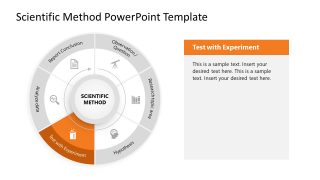
- Testing and Experimentation: In this step, the hypothesis is tested repeatedly using a series of experiments to justify or nullify the hypothesis. If a theory survives the experimentation process, it is termed a theory.
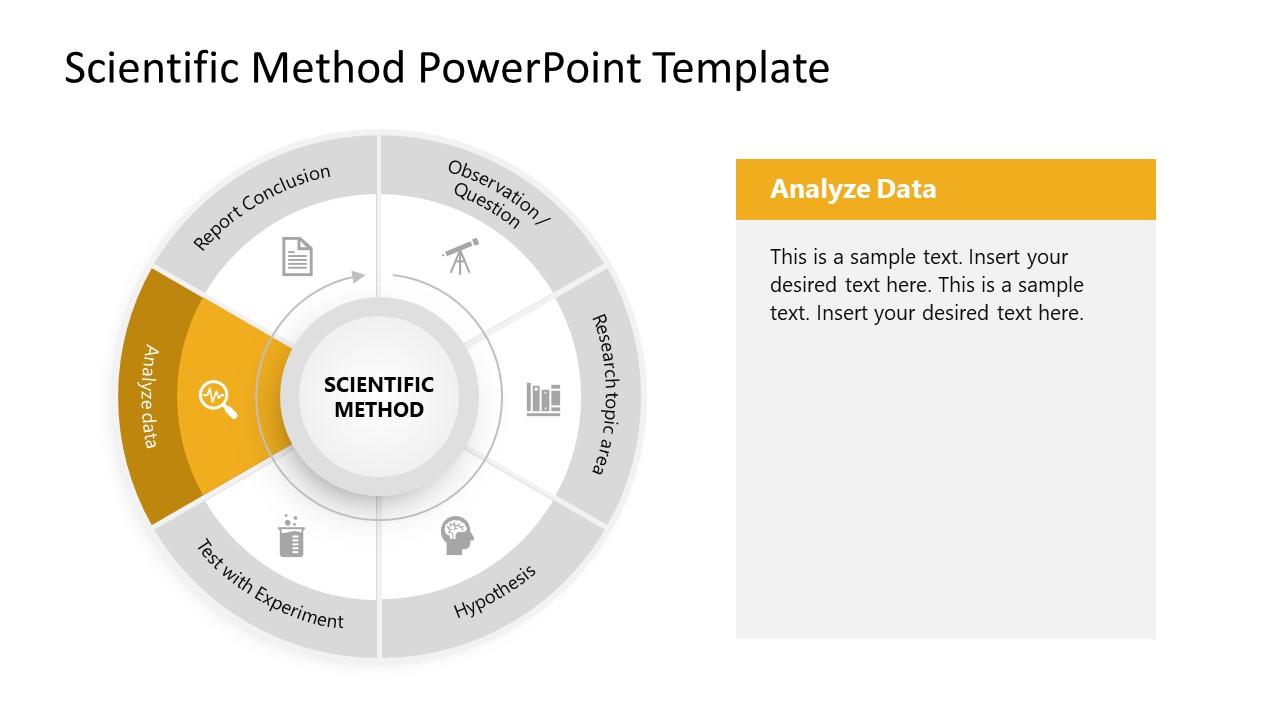
- Data Analysis: Analytical techniques are applied to all the results drawn from the experiments. The data is visualized using charts, graphs, and tables.
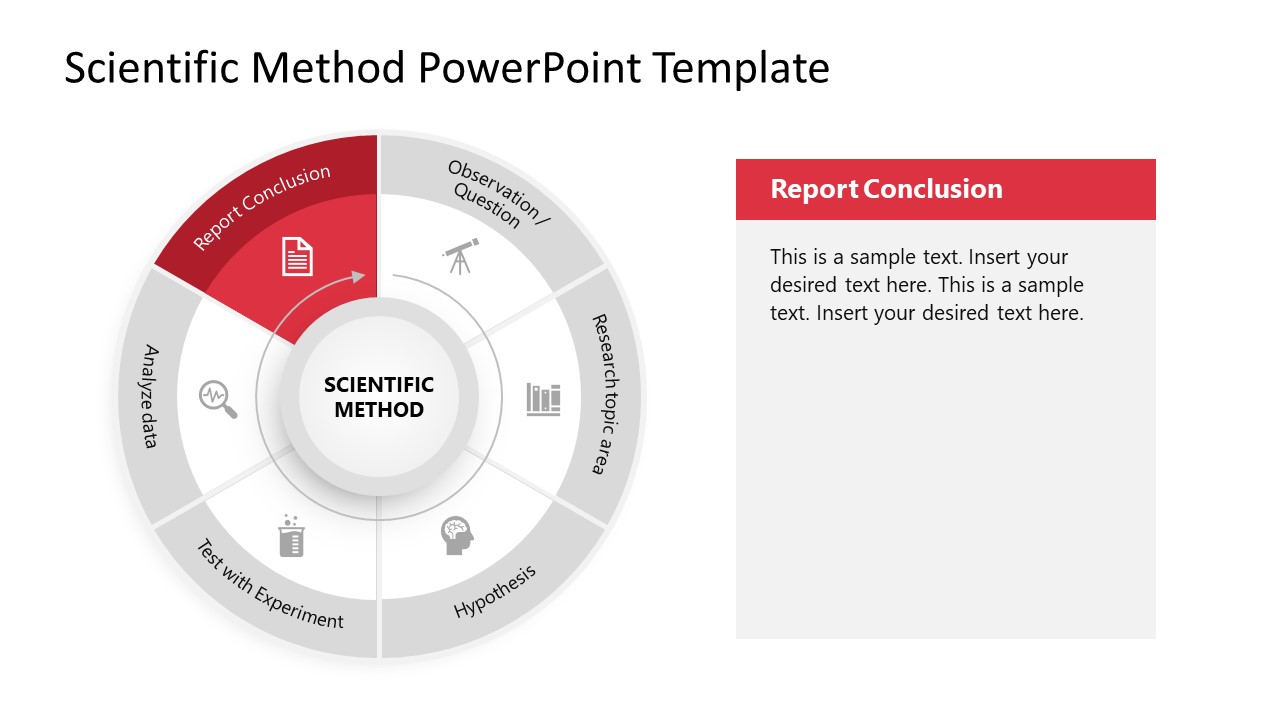
- Report and Conclusion: This is the final stage; in this step, the final reports are designed to present the conclusion of the research process.
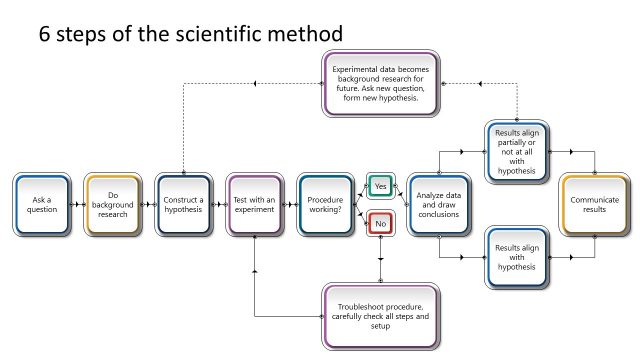
The Scientific Method Diagram PowerPoint Template contains a title slide with the central diagram. The circular diagram contains eight sections with corresponding text boxes around the central figure. Six segments display the six steps of the scientific method using infographic icons that enhance the visual impact of the presentation. Presenters can utilize the text boxes to mention the brief details about the point. The scientific method can also be visualized with a scientific method flow chart diagram. Next, in the following slides, we provided the same diagram on each slide with a spotlight effect and single large text boxes. Only one diagram segment is color-highlighted, and the other sections are greyed. Users can display the corresponding details in the large text box. This helps the audience understand the details engagingly. You can also learn how to prepare a scientific presentation using Microsoft PowerPoint.
Users can change the template’s colors and other PPT elements according to their preferences. So, download this template and present your case studies now!


You must be logged in to download this file.
DOWNLOAD- Category
- Diagrams
- Rating

 Loading...
- Size
- 16x9
- Item ID
- 22139-01
- Colors
Subscribe today and get immediate
access to download our PowerPoint templates.