Project Management Dashboard Template
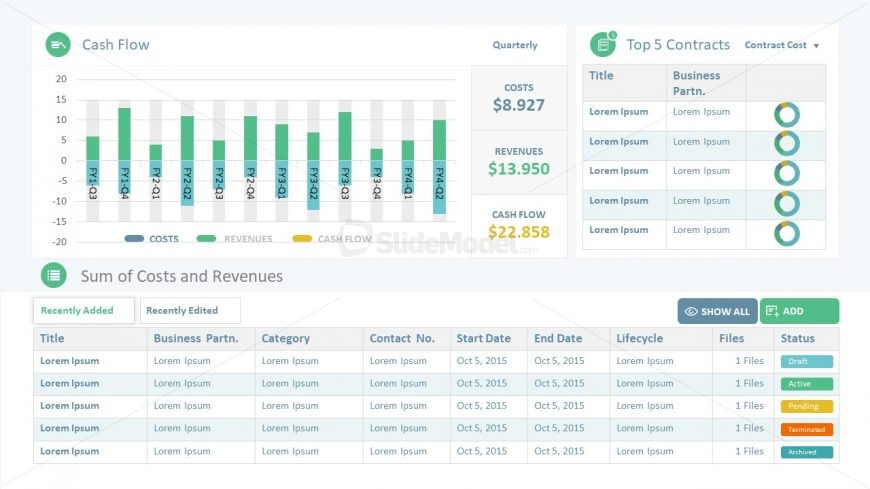
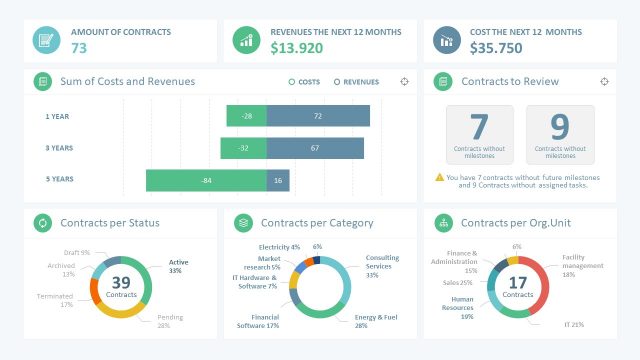
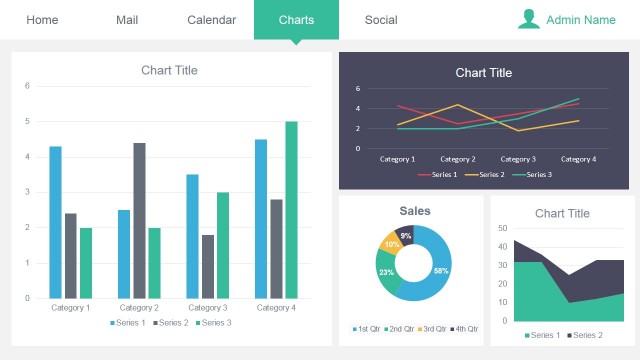
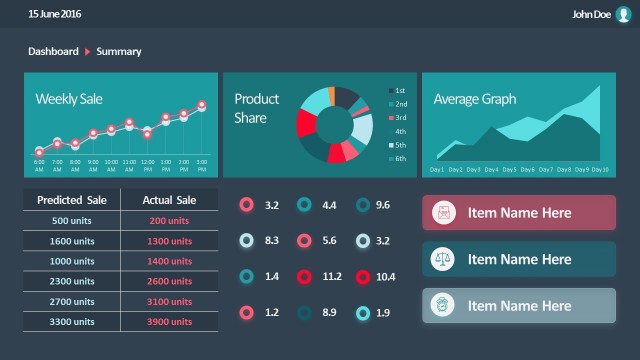
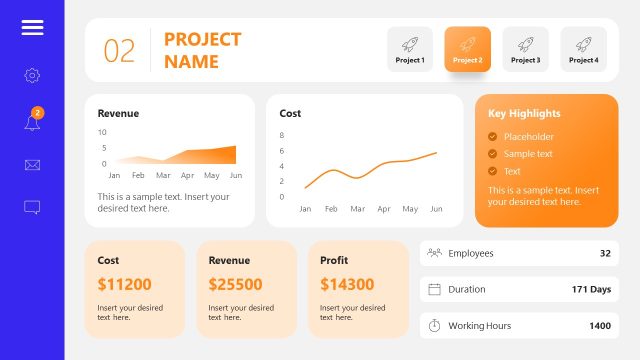
This sales management PowerPoint slide is a Project Management Dashboard Template with three useful sections. This presentation contains charts, graph and tables to display the data in an organized and graphic format. There are infographic clipart and icons representing the labels of rectangular bars. There are five donut charts and vertical stock chart to display the contract cost and cash flow. The users can edit these sections to demonstrate other analysis reports. Further, the table in PowerPoint includes creative status bar which makes it attractive part of dashboard. The colorful bars and shapes makes the dashboard visually attractive to the audience.
Return to Sales Manager PowerPoint Dashboard.
Download unlimited PowerPoint templates, charts and graphics for your presentations with our annual plan.
DOWNLOADReturn to Sales Manager PowerPoint Dashboard.
