Slide 1 of 1 from Root Cause Analysis Slide PowerPoint Template
Root Cause Analysis Presentation Slide Template
Root Cause Analysis Diagram for Presentations
- Diagram
- Cause Effect
- Strategic Analysis Slide
- 16:9
- 100% Editable
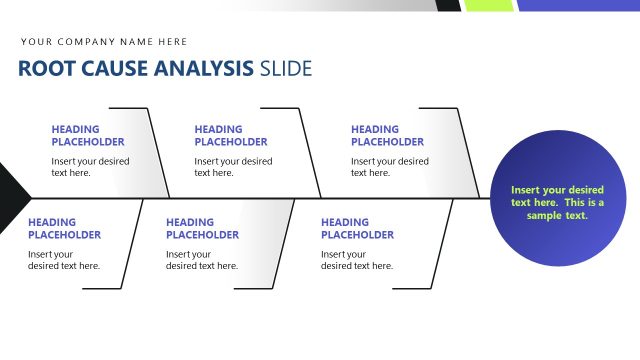
The Root Cause Analysis Diagram slide from the Root Cause Analysis Slide PowerPoint Template offers a clear visual layout for identifying multiple causes leading to a central effect. This slide template is ideal for business presentations focused on quality control and problem-solving, featuring editable shapes and vector icons to enhance clarity in strategic analysis. It supports effective communication in corporate presentations and pitch deck templates by illustrating cause-effect relationships with precision.
What’s on This Slide
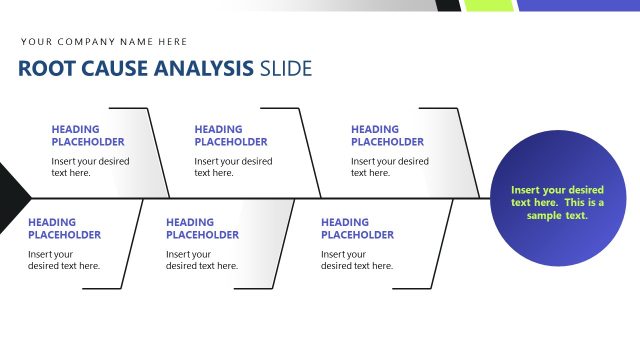
The layout features a central box connected to six arrows, each labeled as 'Cause 1' through 'Cause 6'. The arrows point toward the central box, indicating a flow from the causes to the effect. Each cause has a text placeholder for descriptions, positioned above the arrows. The central box also contains a text placeholder for the main conclusion or effect. The background is white, and the arrows are outlined in blue with a gradient effect. The overall composition emphasizes a clear directional flow from multiple causes to a single outcome.
How to Use It
This layout serves to illustrate the relationship between multiple causes and a central effect, commonly used in root cause analysis presentations. It fits well in a sequence following a problem statement, helping to visually connect causes to their impact. This structure is useful in business scenarios such as quality control discussions, project management reviews, or problem-solving workshops, where identifying root causes is essential for effective solutions.
Text Placeholders & Capacity
Keep your copy within these limits so it fits without resizing. Each cause can hold about 50 characters for detailed descriptions.
| Placeholder | Count | Max characters (approx.) |
|---|---|---|
| Item heading | 6 | 30 |
| Item body | 6 | 50 |
| Item body | 1 | 50 |
Slide Keywords
Download unlimited PowerPoint templates, charts and graphics for your presentations with our annual plan.
DOWNLOAD