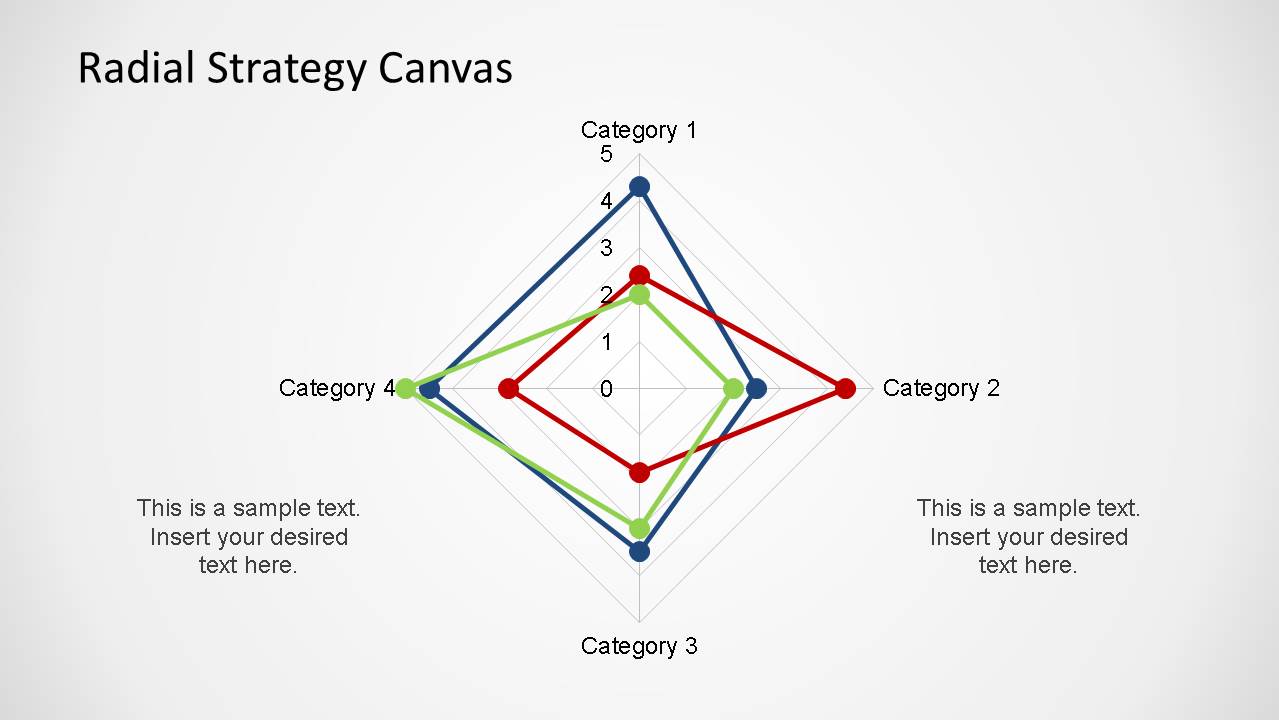
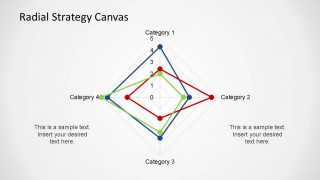
Radial Strategy Canvas PowerPoint Template is a professional Strategy Canvas presentation built around a Radial Chart. A Strategy Canvas is a core diagnostic and action framework used to compare competitive factors across different value propositions. Use this template to analyze competitors and highlight comparative advantages during your strategy discussions.
This presentation leverages Excel integration, enabling you to edit the dataset and adjust the chart structure through a tabular interface. This approach makes the radial chart highly customizable and easy to update, without the need to manually modify each individual PowerPoint shape.
Every slide can be customized, allowing you to tailor the design and content to fit the needs of your presentation.
Alternatively, download other radial PPT diagrams for PowerPoint & Google Slides, including radial charts and infographics to present your ideas clearly.
What’s inside this template
Example presentation scenarios
- A strategy consultant can use the radial canvas to compare a client's current offering against two competitor profiles and explain where the client has a stronger value curve.
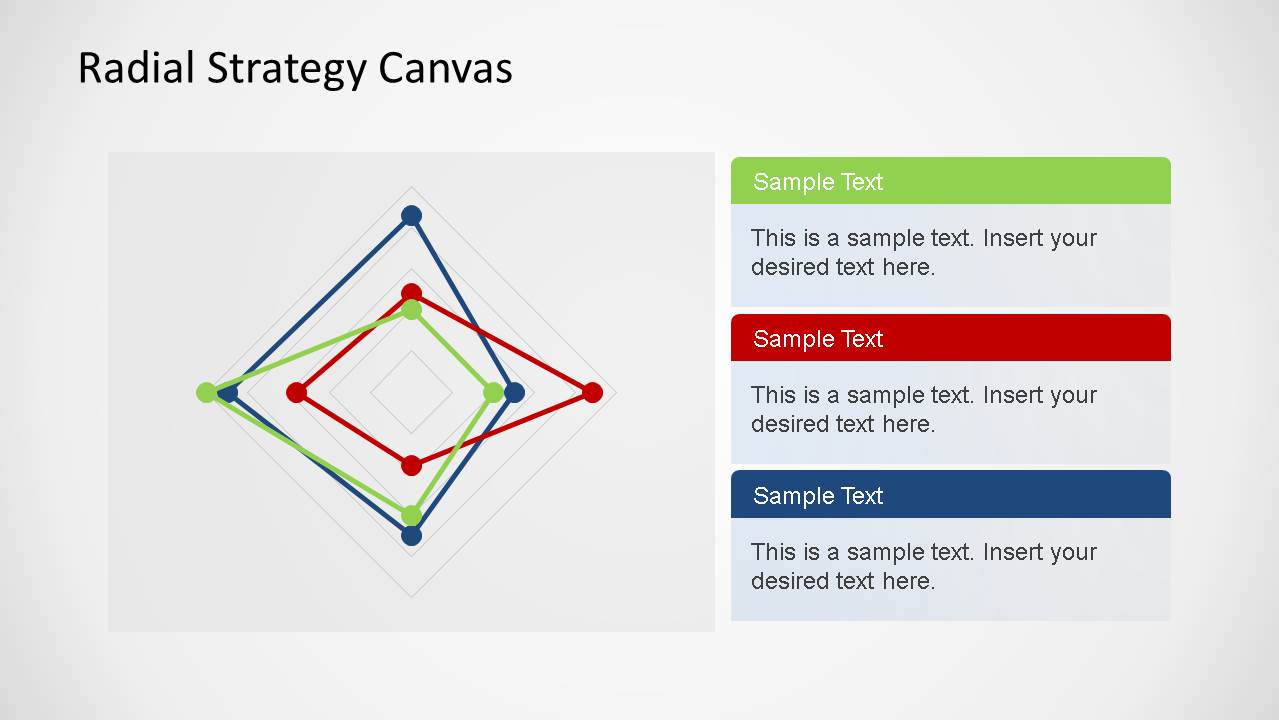
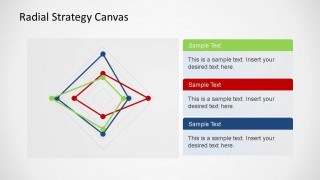
- A product manager can use the stacked callout slide to translate the radial chart into three action notes for pricing, features, or customer experience.
- An executive team can use the three-column comparison panel to summarize strategic alternatives before selecting a market positioning direction.
- A marketing strategist can use the colored radial lines and category labels to show which value factors should be emphasized in a competitive narrative.
Features
- 100% editable presentation template
- Compatible with Microsoft PowerPoint and Google Slides
- Scalable vector shapes, icons and illustrations
- AI-Ready for Microsoft Copilot and Claude
- Instant access and download
Frequently asked questions
Q: How should a presenter explain the radial strategy canvas without overwhelming the audience?
A: Start by defining the category axes before discussing the colored lines. Read the shape of each line as a value profile, not as isolated points. Then move to the callout slide to explain the strategic meaning behind the gaps, such as which factors are overinvested, underinvested, or likely to create advantage.
Q: Who is this template best suited for in a strategy discussion?
A: This template fits consultants, product leaders, and executives who need to compare alternatives across the same set of competitive factors. It works best when the audience already understands the market and needs a clear visual frame for discussing positioning, differentiation, or blue ocean strategy choices.
Q: Why does the radial chart metaphor help with competitive advantage analysis?
A: The radial chart makes each offer look like a visible value shape, so differences become easier to compare than in a list of factors. The surrounding category labels create a shared frame, while the separate callout and three-panel slides give the presenter space to turn the visual pattern into decisions.

Radial Strategy Canvas PowerPoint Template
3-slide PowerPoint presentation template for radial strategy canvas and competitive advantage analysis
The Radial Strategy Canvas PowerPoint Template is a 3-slide strategy template for comparing competitive factors with a radial chart. It includes a radar-style strategy canvas, stacked callout notes, and three-column comparison panels for strategists, consultants, and business teams. Chart data can be edited as an Excel spreadsheet in PowerPoint.


 Loading...
 Microsoft PowerPoint
  Microsoft Copilot
  Claude for PowerPoint
 Other formats supported
Subscribe today and get immediate
access to download our PowerPoint templates.