Slide 2 of 2 from Quarters Timeline Infographic PowerPoint Template
Editable Quarters Timeline Infographic PPT Template
Quarterly Timeline Overview for Presentations
- Diagram
- Timeline Horizontal
- Timeline Slide
- 16:9
- 100% Editable
The Quarterly Timeline Overview slide from the Quarters Timeline Infographic PowerPoint Template provides a clear horizontal timeline layout ideal for quarterly reviews and strategic planning. This slide uses editable shapes and vector icons to visually represent progress across four quarters, making it suitable for business presentations and project updates. Its clean design supports effective communication of timelines within corporate presentations and pitch deck templates.
What’s on This Slide
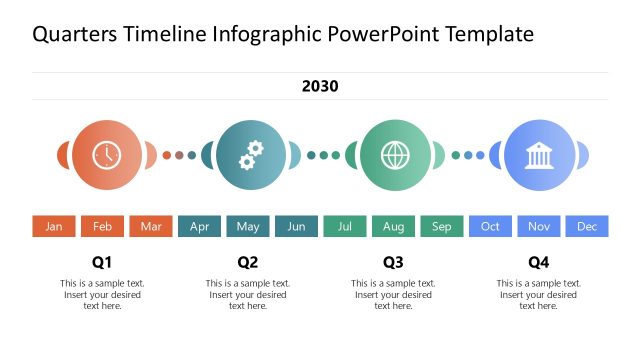
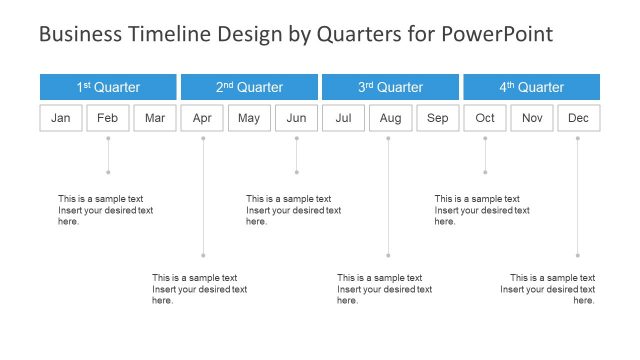
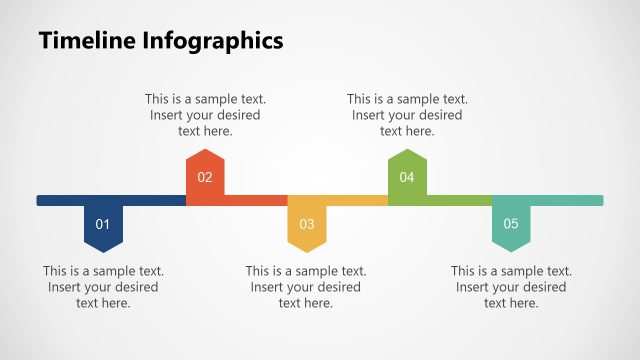
The layout features four circular nodes labeled Q1, Q2, Q3, and Q4, arranged horizontally across the center. Each node is connected by a series of small circles, indicating a flow from one quarter to the next. Below each node, there are text placeholders aligned centrally, allowing for additional descriptions or details related to each quarter. The nodes vary in color from orange to blue, creating a gradient effect. The overall composition is clean, with a white background that emphasizes the colorful nodes and connecting elements.
How to Use It
This layout serves as a quarterly timeline, ideal for presenting progress or plans over the year. It fits well in a presentation sequence following a problem statement or analysis, leading into a roadmap or action plan. Suitable for business reviews, project updates, or strategic planning sessions, this structure allows for clear communication of quarterly objectives and achievements, making it easy for audiences to follow the timeline visually.
Text Placeholders & Capacity
Keep your copy within these limits so it fits without resizing. Node body slots can hold about 40 characters each.
| Placeholder | Count | Max characters (approx.) |
|---|---|---|
| Item heading | 4 | 2 |
| Item body | 4 | 40 |
Slide Keywords
Download unlimited PowerPoint templates, charts and graphics for your presentations with our annual plan.
DOWNLOADReturn to Quarters Timeline Infographic PowerPoint Template.