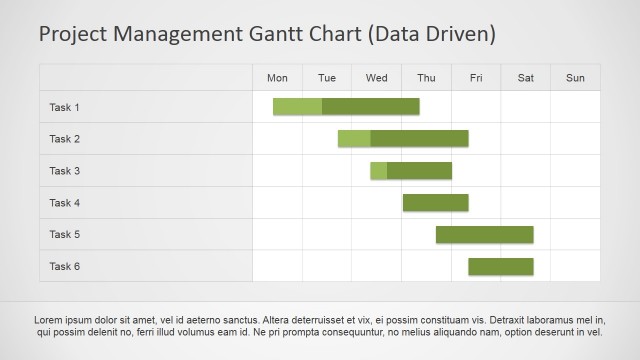
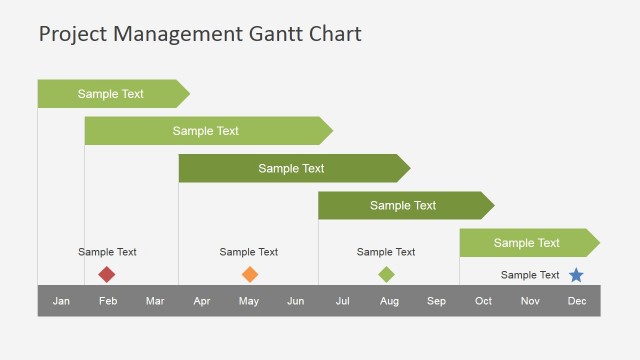
Project Work Scheduling using Gantt Chart
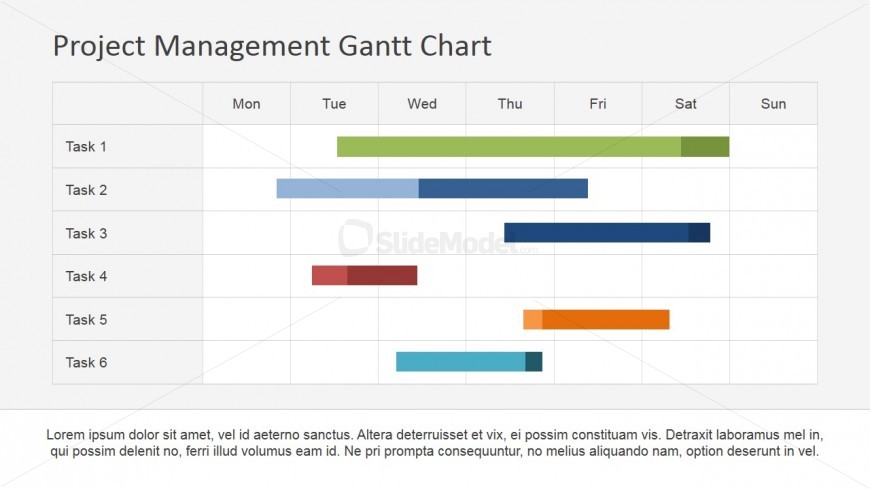
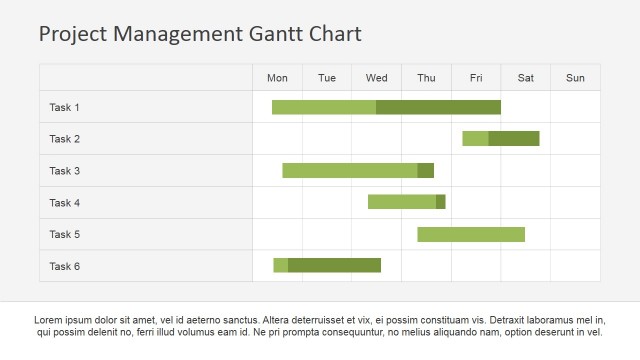
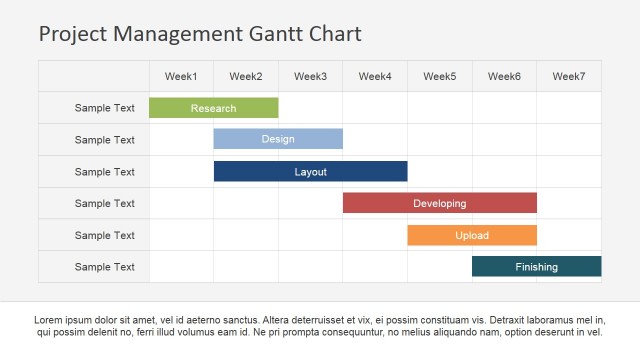
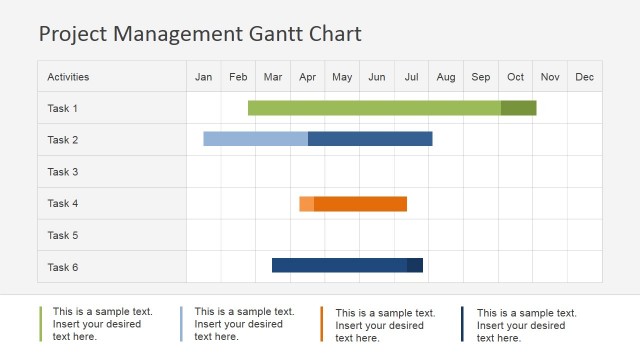
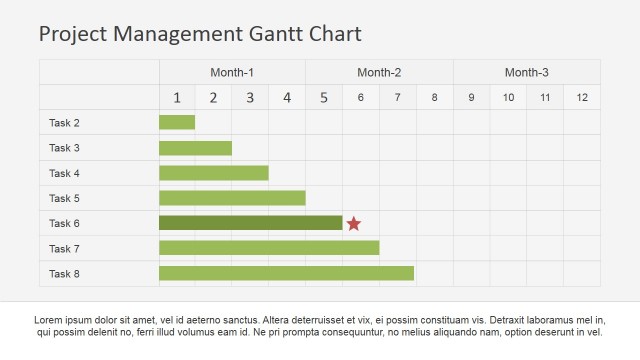
This PowerPoint Slide describes the tasks related to the project plotted against time in a horizontal graphical manner. Different colors can be used to show the duration of each individual task series. The viewers can easily understand when a task stated and when it ended, or the current progress of execution. You can also figure out which task executed in parallel. Tasks can be allotted names as per the project. Corresponding horizontal bar shows its time period. It is easy to interpret which task takes the longest time while which one takes the smallest time to finish. Small descriptions can be added at the end of the slide.
Return to Project Management Gantt Chart PowerPoint Template.