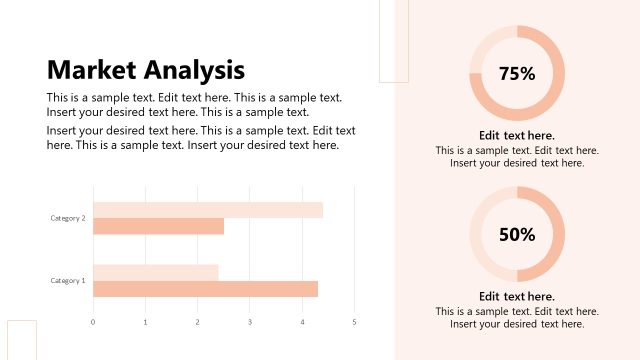
Business Product Analysis Doughnut Chart

The Business Product Analysis Doughnut Chart presents the review of an item. It could be a product or service, and the presentation can help explaining the likability in consumer market. The doughnut chart can guide the audience to view the performance of product and rate it in percentage. For example, by rating the features, estimate the sales and profit. The analysis may include processes, functions, customer feedback etc. The donut chart provides an easy way to edit the color part. By simply selecting the donut diagram, the two yellow dots appear. The user can increase or decrease the percentage by dragging these two points.
Return to Professional Business Slide Deck PowerPoint Template.