Slide 9 of 16 from Professional Annual Report PowerPoint Template
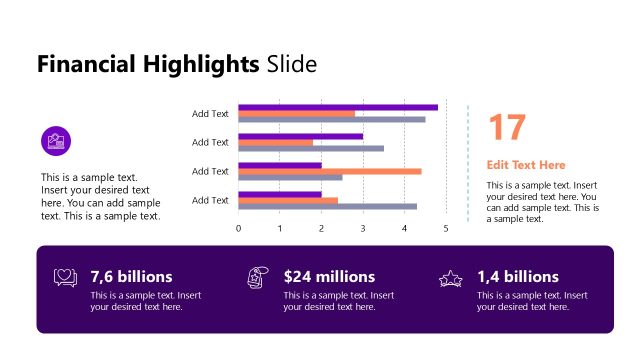
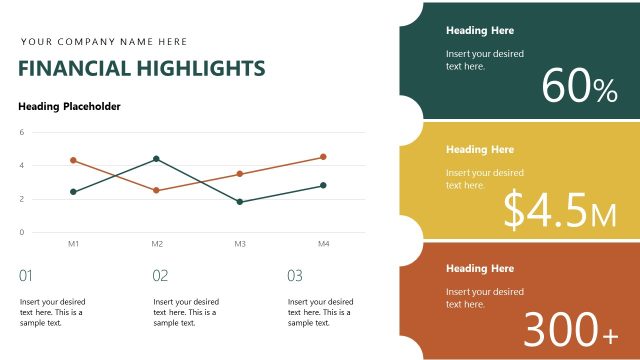
Financial Highlights Slide with Data Driven Chart
Financial Highlights Slide for Reports
- Chart
- Line Chart
- Evaluation Slide
- 16:9
- 100% Editable
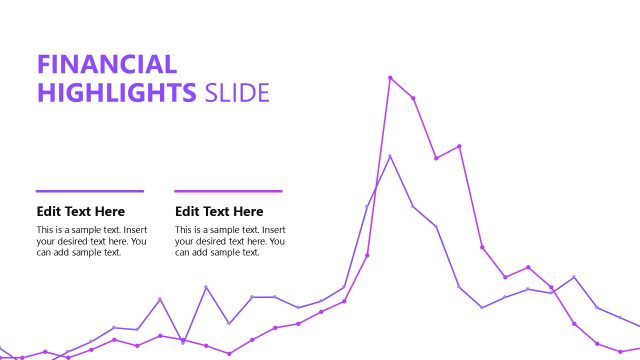
The Financial Highlights Slide from the Professional Annual Report PowerPoint Template offers a clear layout with a line chart and data boxes to effectively summarize financial performance. This slide template is ideal for business presentations and annual reports, providing editable slides that help communicate key financial metrics with clarity and precision.
What’s on This Slide
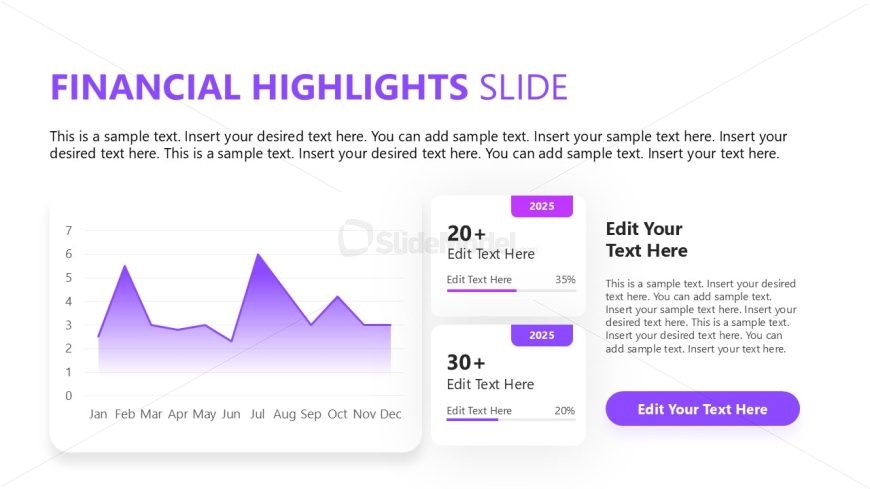
The slide features a line chart positioned on the left, displaying financial data over months from January to December. The chart has a purple gradient line with grid lines for reference. To the right, there are two rectangular data boxes, each labeled with the year 2025, containing numerical values and progress bars. Text placeholders are present above the chart and below the data boxes, with a larger title at the top. The overall layout is balanced, with a clear visual hierarchy emphasizing the chart and key figures.
How to Use It
This layout serves to present financial highlights in a report, making it suitable for summarizing key metrics. It fits well in a sequence following an overview or introduction, providing a detailed view of financial performance. This structure is useful for business presentations, annual reports, or project updates where financial data needs to be clearly communicated to stakeholders.
Text Placeholders & Capacity
Keep your copy within these limits so it fits without resizing. Body slots are tight, roughly 10-15 words each.
| Placeholder | Count | Max characters (approx.) |
|---|---|---|
| Slide title | 1 | 30 |
| Item body | 2 | 50 |
| Body paragraph | 3 | 100 |
Slide Keywords
Download unlimited PowerPoint templates, charts and graphics for your presentations with our annual plan.
DOWNLOAD