Slide 4 of 5 from Product Life Cycle Curve for PowerPoint
Maturity Stage of Product Life Cycle for PowerPoint
Product Life Cycle Curve for PowerPoint
- Diagram
- Other
- Concept Explanation Slide
- 16:9
- 100% Editable
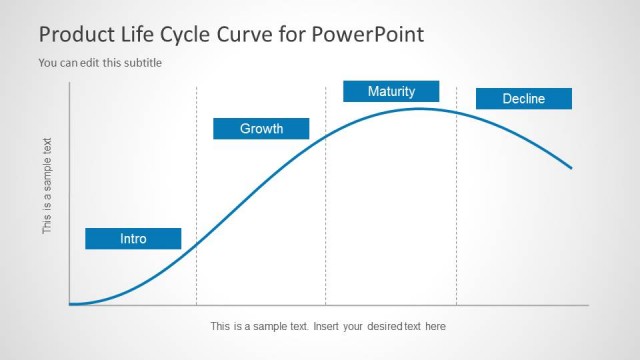
The Product Life Cycle Curve slide from the Product Life Cycle Curve for PowerPoint template visually explains the stages of product development using editable slides with vector icons. This slide layout supports business presentations focused on marketing strategy and product lifecycle analysis by clearly illustrating growth, maturity, and decline phases within a corporate presentation or pitch deck template.
What’s on This Slide
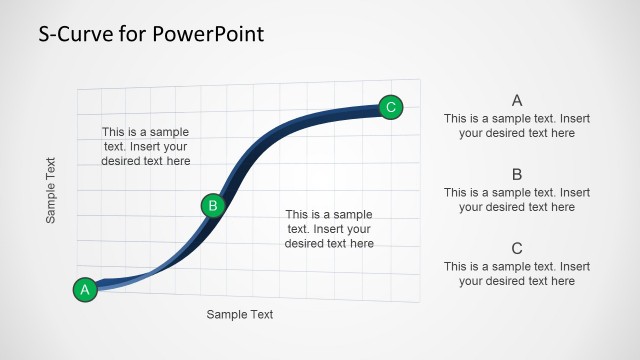
The layout features a curved graph with three distinct lines representing different stages of the product life cycle. The lines are labeled with letters a, b, and c, and there are text placeholders positioned along the curves for descriptive content. A central circular node is present on the top curve, with a legend indicating its meaning. Additional text placeholders are located at the top and bottom of the slide, providing space for a title and subtitle. The background is light with a subtle gradient, enhancing the visual hierarchy.
How to Use It
This layout serves to illustrate the product life cycle stages, making it suitable for presentations on product development and marketing strategies. It fits well after introductory slides and before detailed analysis, allowing for a clear visual representation of growth, maturity, and decline phases. This structure is useful in business contexts such as product launches, marketing strategy discussions, and lifecycle analysis presentations, facilitating understanding of product performance over time.
Text Placeholders & Capacity
Keep your copy within these limits so it fits without resizing. Node body slots are tight, roughly 10 words each.
| Placeholder | Count | Max characters (approx.) |
|---|---|---|
| Slide title | 1 | 40 |
| Subtitle | 1 | 40 |
| Item heading | 3 | 30 |
| Item body | 3 | 50 |
| Legend | 2 | 20 |
Slide Keywords
Download unlimited PowerPoint templates, charts and graphics for your presentations with our annual plan.
DOWNLOADReturn to Product Life Cycle Curve for PowerPoint.