Product Development Over Time PowerPoint Template
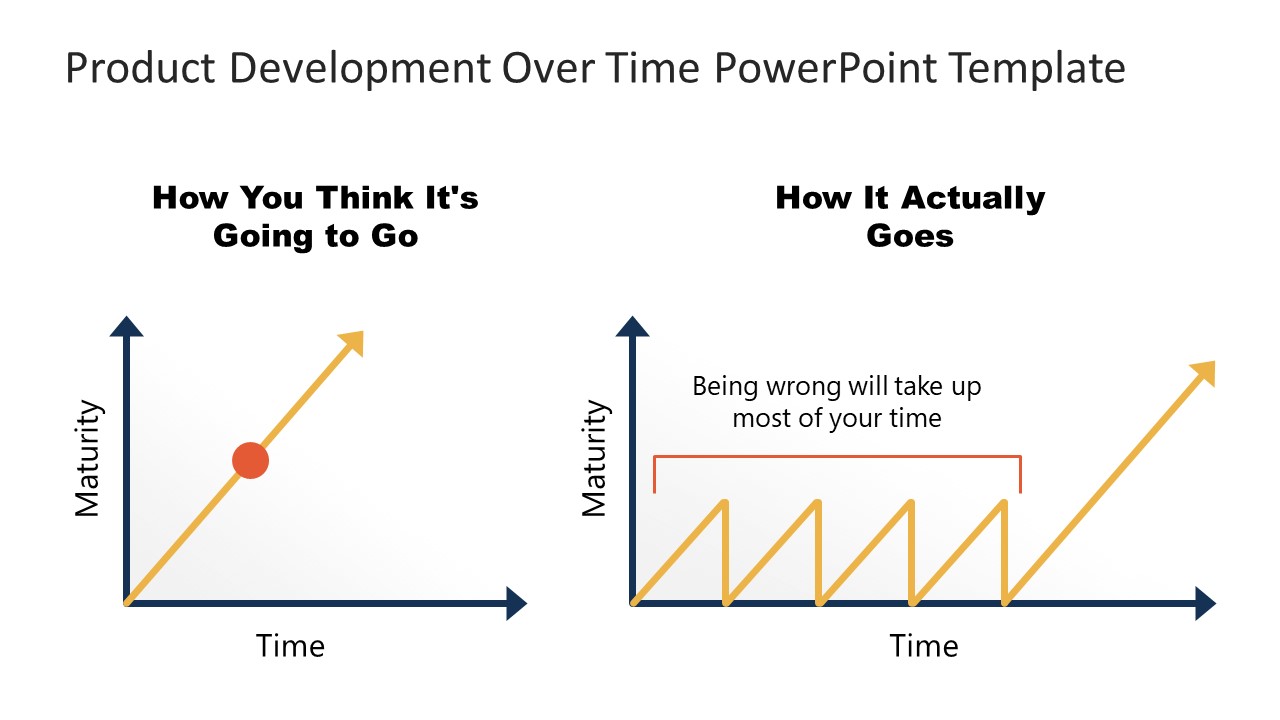
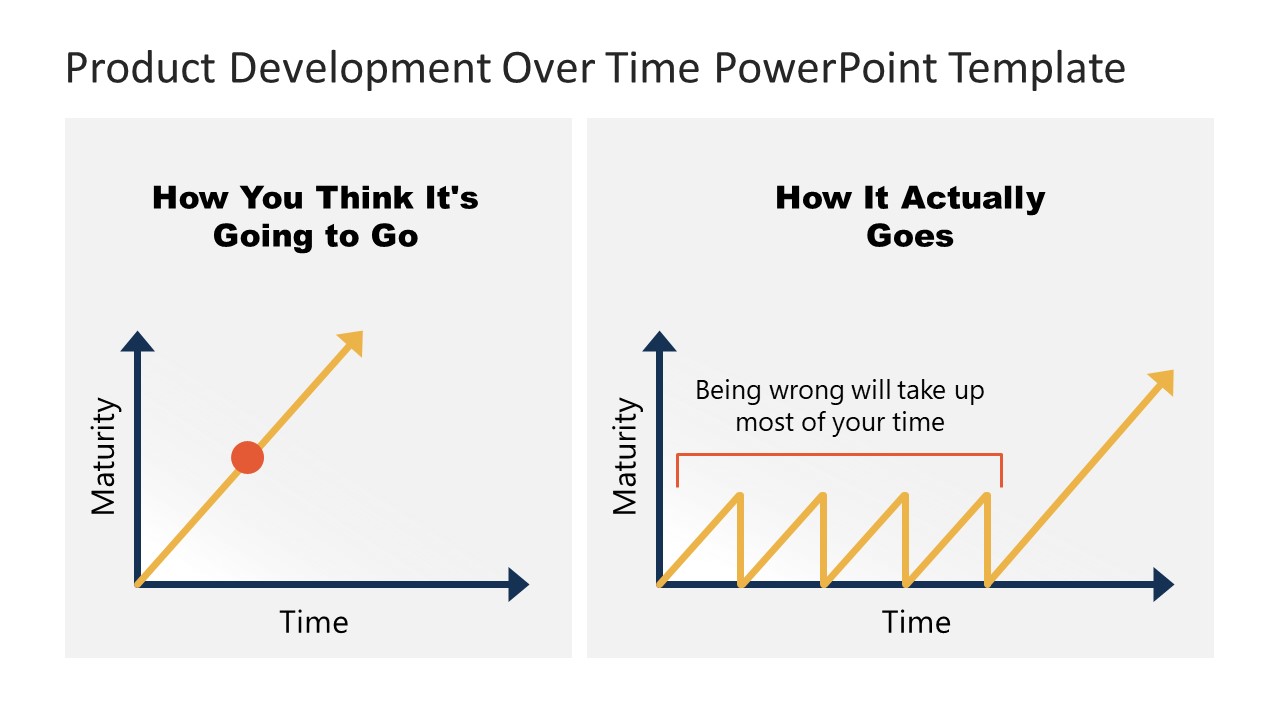
The Product Development Over Time PowerPoint Template presents concept diagrams for lean startups. The PowerPoint template contains two slides of charts in white and gray backgrounds. These charts help in visualizing the progress of development models over time. The chart template of linear growth trends represents the waterfall model. Here, you can describe the risks involved in the waterfall approach while developing an innovative product. The second chart illustrates an agile or lean process to release products in stages. This method helps mitigate risks while focusing on validating and learning from failures.
Over time, the PowerPoint charts of product development display the exception vs. reality of startup progress. These charts help present startup plans and business strategies to set realistic expectations. Take an example of innovative product development as a startup project. The Product Development Over Time PowerPoint Template demonstrates the possibility of failures from the start. These charts enable startups and entrepreneurs to see their losses and learn from them. It encourages them to learn from mistakes and build products better than the initial idea. Alternatively, you can download other product development slides for presentations.
The chart template of lean startup product development has three sections. The maturity in the y-axis describes the growth in an upward direction. The time in the x-axis shows how much time has been covered in the lean startup process. The arrow line represents progress. A zigzag line in the second chart displays learning iteration from failed attempts. The faster iterations result in more rapid learning and improvement.
