Polygonal Venn Diagram PowerPoint Template
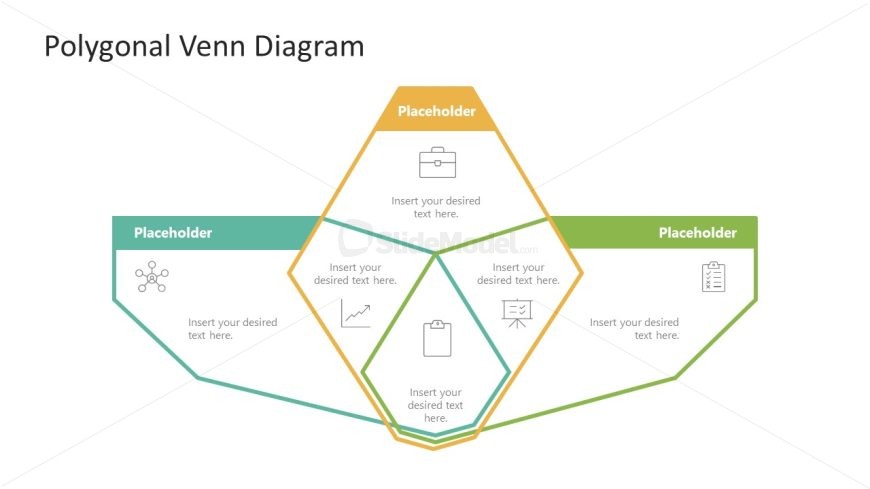
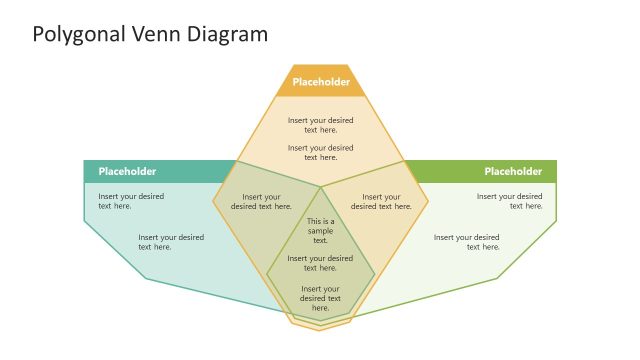
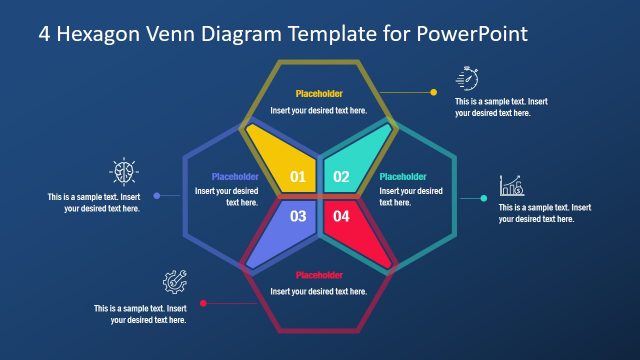
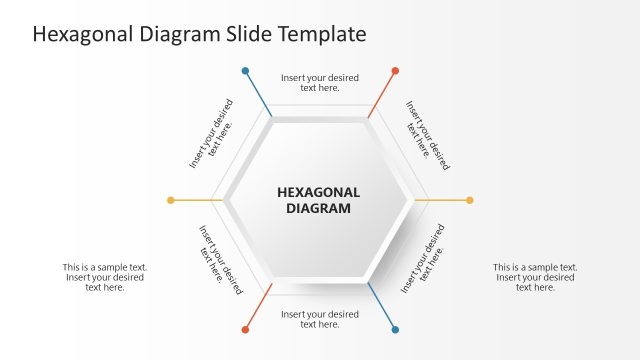
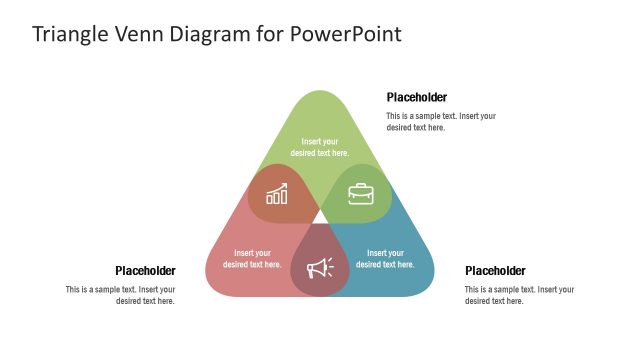
The image displays a slide titled “Polygonal Venn Diagram,” designed for a PowerPoint presentation. It features a central hexagonal diagram surrounded by three additional placeholder text boxes, each connected to a side of the hexagon with a thin line. The hexagon is divided into six segments, each with its own placeholder text and icon, suggesting that each segment represents a different category or idea that can be inserted into the presentation.
The layout is clean and modern, with a color scheme that employs shades of green and yellow. The outer placeholders are shaded in green, while the hexagon transitions from green to yellow from the edge to the center. The icons include a cluster of circles, a briefcase, a document, and other abstract representations that are commonly used in presentations to symbolize concepts like teamwork, business, and documentation.
The slide is designed to visually organize information and show how different concepts or data sets intersect and relate to one another. It can be used in various professional settings, such as business meetings, academic lectures, or workshops, where presenters need to illustrate complex relationships between topics in a straightforward and visually appealing way. The placeholders are strategically placed to guide the presenter in adding relevant text, ensuring the information is clearly conveyed to the audience.
Return to Polygonal Venn Diagram.
Download unlimited PowerPoint templates, charts and graphics for your presentations with our annual plan.
DOWNLOADReturn to Polygonal Venn Diagram.
